- Home/
- GATE MECHANICAL/
- GATE ME/
- Article
Fatigue Strength and the S-N Diagram Study Notes for GATE & Mechanical Engineering Exams
By BYJU'S Exam Prep
Updated on: September 25th, 2023

In engineering, understanding how materials and structures respond to cyclic loading is crucial for designing safe and reliable components. Fatigue strength refers to a material’s ability to withstand repeated loading and unloading without failure. This phenomenon is particularly important in industries such as aerospace, automotive, and structural engineering, where components often experience cyclic stresses during their operational life. The S-N diagram, also known as the Wöhler curve, is a powerful tool used to represent the fatigue behaviour of materials graphically. It showcases the relationship between stress amplitude and the number of cycles to failure, providing valuable insights into a material’s fatigue performance under various loading conditions.
In these introductory study notes, we embark on a journey to explore the fundamental concepts of fatigue strength and the S-N diagram. You will learn about the mechanisms of fatigue failure, the factors influencing fatigue life, and the significance of endurance limit and fatigue limit. Additionally, we will delve into how the S-N diagram is constructed and how it helps engineers predict the fatigue life of materials and make informed decisions during the design process. Whether you are a student preparing for engineering exams or a professional seeking to enhance your knowledge in fatigue analysis, these study notes will equip you with the essential tools to tackle real-world challenges in material and structural design.
Table of content
-
1.
Dynamic Loading

-
2.
Fatigue failure
-
3.
Endurance limit
-
4.
Fatigue life
-
5.
Low-cycle and High cycle fatigue
-
6.
Reversed stresses: Design for finite and Infinite life
-
7.
Stress concentration
-
8.
Causes of stress concentration
-
9.
Reduction of stress concentration
-
10.
Failure Criteria under fatigue loading
-
11.
Important Tips for GATE Preparation
-
12.
Accelerate your GATE 2022 preparations with BYJU’s Exam Prep Online Classroom Program
-
13.
Related Important Links
Dynamic Loading
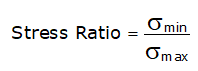
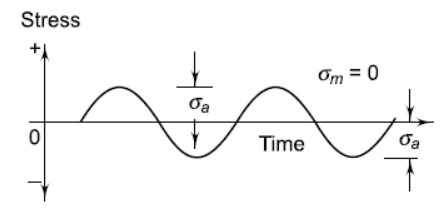
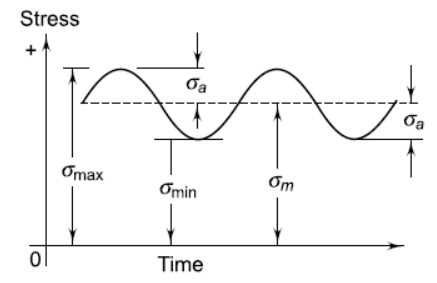
(b). Fluctuating stresses: These vary from a minimum value to a maximum value and these are of the same nature, either tensile or compressive, and are called fluctuating stresses.
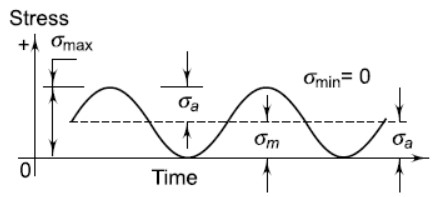
Repeated stresses: These are the stresses whose magnitude varies from zero to a certain maximum value.
Alternating stresses: The loading in which the stresses vary from a minimum value to a maximum value with opposite nature and these stresses are known as alternating stresses.
Fatigue failure
- Materials fail under fluctuating stresses at a stress magnitude which is lower than the ultimate tensile strength of the material and sometimes it is even lower than the yield strength.
- It has also been found that the magnitude of the stress causing failure decreases as the number of stress cycles increases.
- Fatigue failure is known as a time-delayed fracture under cyclic loading.
- The fatigue failure depends upon a number of factors, such as the number of cycles, mean stress, stress amplitude, stress concentration, residual stresses, corrosion, size of the component and creep.
Endurance limit
- The fatigue or endurance limit is the maximum amplitude of completely reversed stress which the standard specimen can be subjected to an unlimited number of cycles 106 without fatigue failure.
- It is used for reverse bending only.
Fatigue life
- The number of stress cycles completed by a standard test specimen before the first fatigue crack appearance is called Fatigue life. The results of this test are plotted by means of an S-N curve.
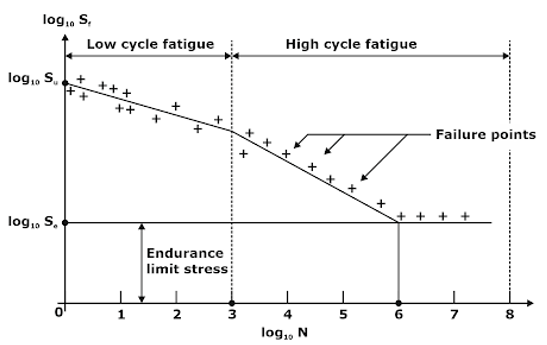
- The graphical representation of stress amplitude (Sf) vs. the number of stress cycles (N) before the fatigue failure on a log-log graph paper is known as S-N Curve.
- The S-N curve becomes asymptotic at 106 cycles for ferrous materials like steel and it shows the stress amplitude corresponding to an infinite number of stress cycles. The endurance limit of the material is the magnitude of this stress amplitude corresponding to the 106 cycles.
- For non-ferrous metals like aluminium alloys, the S-N curve slopes gradually even after 106 These materials do not exhibit a distinct value of the endurance limit in a true sense.
Low-cycle and High cycle fatigue
Two regions of the S-N curve are termed low-cycle fatigue and high-cycle fatigue:
- Low-cycle fatigue: It is the fatigue failure for which the number of stress cycles < 1000. The basis of design for the low cycle fatigue components is ultimate tensile strength or yield strength with a suitable factor of safety.
- High cycle Fatigue: It is the fatigue failure for which the number of stress cycles is> 1000. The basis of design for the high cycle fatigue components is endurance limit stress. S-N curves such as Soderberg, Gerber or Goodman criteria are followed for the design of such components.
Reversed stresses: Design for finite and Infinite life
Case 1: When the component is to be designed for infinite life, the endurance limit becomes the criterion of failure.
Case 2: When the component is to be designed for finite life, the S-N curve can be used. The curve is valid for steel. It has a straight-line AB drawn between 0.9Sut at 103 cycles to Se at 106 cycles on a log-log paper.
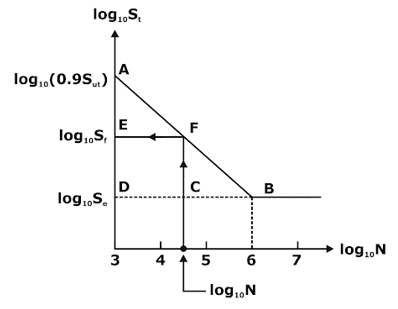
- Locate point A and B with coordinates [3, log10(0.9Sut)] since log10(103) = 3 & [6, log10(Se)] since log10(106)= 6, respectively.
- Now Join the line points A and B and now it is used as a criterion of failure for finite-life problems.
- Corresponding to the life (N) of the component, make a vertical line from log10(N) on the abscissa ( showing intersection at F) and then draw a line FE parallel to the abscissa. The obtained ordinate at E i.e. log10(Sf), shows the fatigue strength corresponding to N cycles.
Stress concentration
- The localization of high stresses caused by the irregularities present in the component and abrupt changes of the cross-section is termed as stress concentration.
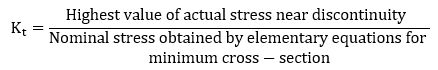
- A stress concentration factor (Kt) is used to consider the effect of stress concentration and it helps in finding the localized stresses:
- In static loading, stress concentration in ductile material is not so serious because in ductile material local deformation or yielding takes place which reduces the concentration.
- The effect of stress concentration factor under static loading is more serious for brittle material because they don’t permit any yielding.
- The effect of stress concentration under fatigue loading is more serious for both materials.
Causes of stress concentration
(a). Variation is properties of materials: It may be due to the following reasons:
- Internal cracks and flaws like blow holes
- Cavities in welds
- Air holes in steel components
- Non-metallic or foreign inclusions
(b). Load Application:
- The engagement of the meshing teeth of the driving and the driven gear.
- The cam and the follower contact.
- The balls and the races contact the ball bearing.
(c). Discontinuities in the component:
- The machine characteristic such as oil holes, keyways and splines provided, and screw threads cause discontinuities in the component cross-section area.
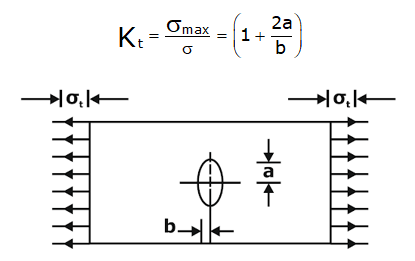
- For a plate with a transverse elliptical hole and subjected to a tensile load as shown in Fig. The theoretical stress concentration factor is given as:
- Machining scratches: Machining scratches, stamp marks or inspection marks are surface irregularities, which cause stress concentration.
Reduction of stress concentration
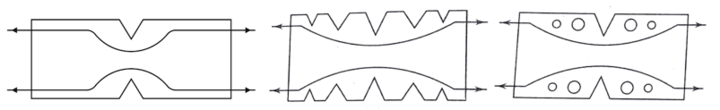
- Single-notch results in a high degree of stress concentration. The severity of stress concentration can be reduced by providing multiple notches. The severity of stress concentration can be reduced by providing multiple drilled holes along with notches.
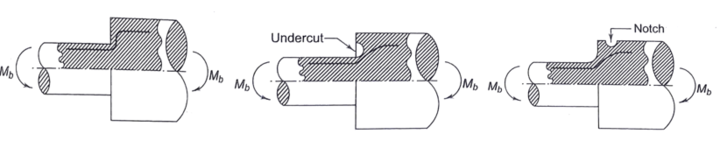
- The figure shows the stepped bar subject to bending moment and it can be seen that the stress line changes rapidly along sudden enlargement. The severity of stress concentration can be reduced by providing undercut and notches.
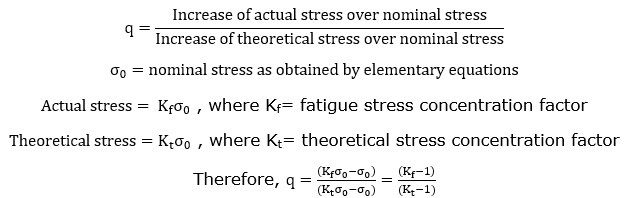
 Notch sensitivity (q):
It is defined as the susceptibility of a material to succumb to the damaging effects of stress-raising notches in fatigue loading:
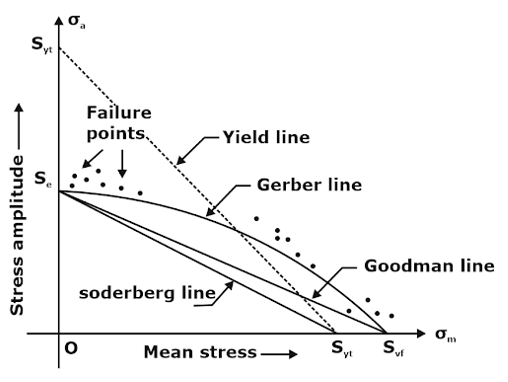
Failure Criteria under fatigue loading
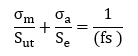
Soderberg criterion: A straight line joining Se (on the ordinate) to Syt (on the abscissa). Here fs is the factor of safety:
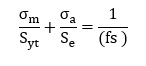
Goodman Criterion: A straight line joining Se (on the ordinate) to Sut (on the abscissa). Here fs the factor of safety, then:
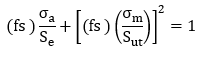
Gerber criterion: A parabolic curve joining Se (on the ordinate) to Sut (on the abscissa). Here fs is the factor of safety:
The Fatigue Strength and the S-N Diagram is an important topic for the mechanical branch asked in GATE ME, SSC JE ME, ISRO ME, ESE IES ME, and other PSU exams.
|
Also, Check |
Important Tips for GATE Preparation
- How to use Virtual Calculator for GATE 2022
- Topper’s strategy for GATE Exam Preparation
- GATE 2022 Exam Syllabus
Accelerate your GATE 2022 preparations with BYJU’s Exam Prep Online Classroom Program
Related Important Links
Get complete information about the GATE exam pattern, cut-off, and all those related things on the BYJU’S Exam Prep official youtube channel.