
- Home/
- GATE MECHANICAL/
- GATE ME/
- Article
Turning Moment Diagram
By BYJU'S Exam Prep
Updated on: September 25th, 2023

Turning Moment Diagram can help us comprehend and explain numerous factors to design an appropriate flywheel for the engine to minimize the crank speed variance during each cycle. It displays the change in the turning moment of an engine as a function of crank angle. The torque change determines the size of the flywheel. More fluctuation equals a larger flywheel and vice versa.
A single curve deviation denotes a one-cylinder engine in the turning moment diagram. On the other hand, a multi-cylinder engine is denoted by several curves. In the turning moment diagram, the amount of power required or created at that angle is represented by the region below and above the mean torque line. Here, we will see turning moment diagram in detail. This article will also discuss the turning moment diagram of a multicylinder engine.
Table of content
What is a Turning Moment Diagram?
A turning moment diagram or crank effort diagram shows the relationship between the turning moment or torque and the crank angle at various crank positions. It is drawn in cartesian coordinates, with the turning moment on the vertical (Y-axis) and the crank angle on the horizontal (X-axis). Because the work done is the product of the turning moment, and the angle turned, the work done per revolution is represented by the area of the turning moment diagram. The engine is assumed to work against the mean resistive torque in actual practice.
Uses of Turning Moment Diagram
The following are some of the applications of a turning moment diagram.
- The work done per cycle is displayed in the section beneath the turning moment diagram.
- The mean torque (Tm) is calculated by dividing the work done every cycle by the crank angle per cycle.
- The power consumed by a machine or developed by an engine is calculated by multiplying the mean torque (Tm) by the angular velocity of the crank.
- The area of the turning moment diagram above the mean torque line represents the surplus energy that the flywheel may store, which aids in designing the flywheel’s dimensions and mass.
Turning Moment Diagram for Single Cylinder Engine
The below figure shows a turning moment diagram for a single cylinder double acting steam engine. The turning moment is represented by the vertical ordinate, while the horizontal ordinate represents the crank angle.
Where,
- T = turning moment
- Fp = Piston effort
- r = Radius of crank
- n = The ratio of connecting rod length to crank radius
- θ = Angle turned by the crank from the inner dead centre
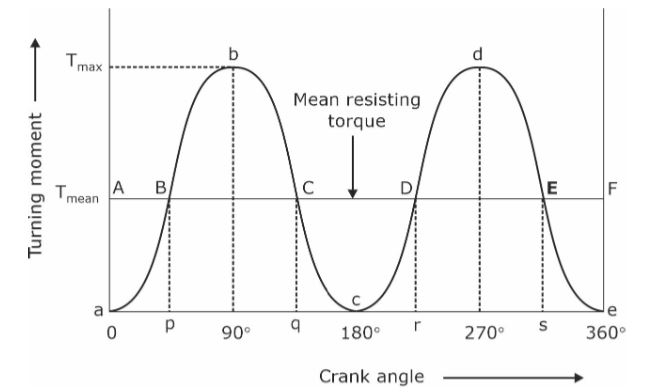
Figure 1: Turning Moment Diagram for Single Cylinder Acting Engine
We can see from the above expression that when the crank angle (θ) is zero, the turning moment (T) is zero. It is maximum when the crank angle is 90 degrees, and when the crank angle is 180 degrees, it is zero. The curve abc show the turning moment diagram for outstroke in Figure. The turning moment diagram for stroke is the curve (cde), similar to the curve (abc). Because the work done is the product of the turning moment, and the angle turned, the work done per revolution is represented by the area of the turning moment diagram.
In reality, the engine is supposed to function against the mean resistive torque, as indicated by the horizontal line (AF). The mean height of the turning moment diagram is represented by the ordinate (aA) height. The area of the rectangle (aAFe) is proportional to the work done against the mean resisting torque since it is assumed that the work done by the turning moment per revolution is equal to the effort done against the mean resisting torque.
Turning Moment Diagram for 4 Stroke Engine
We know that when the crank has turned two revolutions, or 720° (or 4 π radians), there is one functional stroke in a four-stroke cycle internal combustion engine.
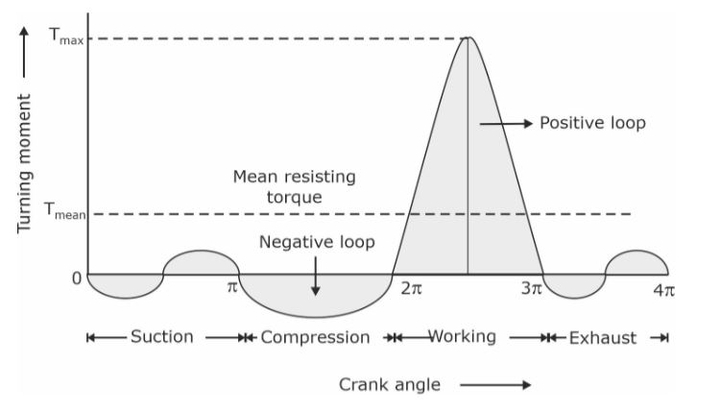
Figure 2: Turning moment diagram for 4-stroke engine
- Suction: During the suction stroke, the pressure within the engine cylinder is lower than the ambient pressure, forming a negative loop as seen in Fig.
- Compression: Work is done on the gases during the compression stroke, resulting in a higher negative loop.
- Working: The fuel burns and the gases expand during the expansion or working stroke, resulting in a big positive loop. The gases are responsible for this stroke.
- Exhaust: Work is done on the gases during the exhaust stroke, resulting in a negative loop.
Turning Moment Diagram for a Multi-Cylinder Engine
The below figure shows a separate turning moment diagram for a compound steam engine with three cylinders and the resulting turning moment diagram. The resulting turning moment diagram is the total of the three cylinders’ turning moment diagrams. The high-pressure cylinder is the first, the intermediate cylinder is the second, and the low-pressure cylinder is the third. When there are three cylinders, the cranks are usually arranged at 120 degrees to each other.
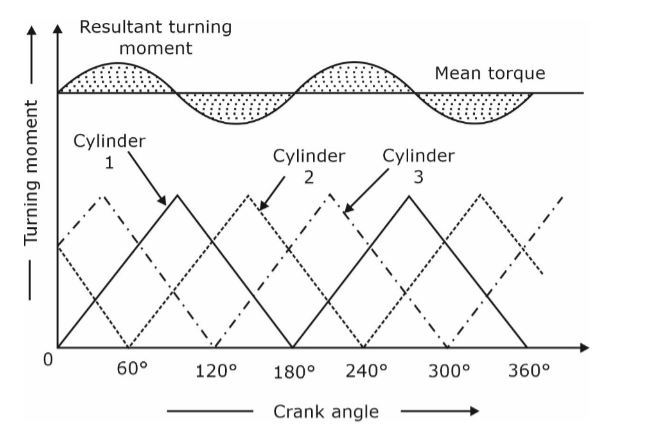
Figure 3: Turning moment diagram for a multi-cylinder engine
Working of Flywheel with the Help of Turning Moment Diagram
A machine’s flywheel functions as a reservoir, storing energy when supply exceeds demand and releasing it when demand exceeds supply. The turning moment diagram for one entire cycle of operation can be used to determine energy fluctuation. Figure 4 shows the turning moment diagram for a single-cylinder double-acting steam engine.
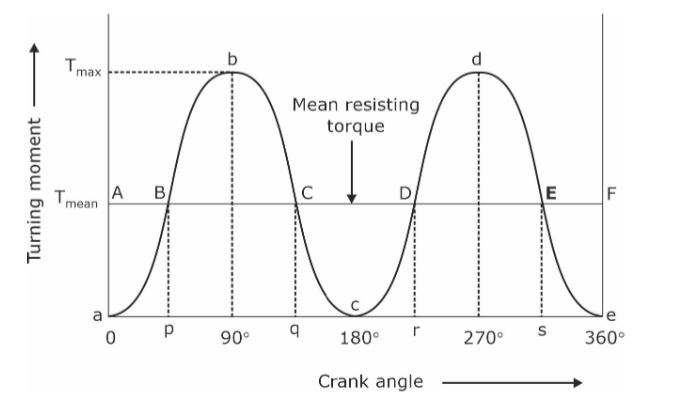
Figure 4: Turning Moment Diagram for Single Cylinder Acting Engine
At locations B, C, D, and E, AF’s mean resisting torque line cut the turning moment. The work done by the engine is equal to the area aBp when the crank moves from a to p, but the energy required is represented by the area aABp. In other words, the engine has completed less work (equivalent to the area AB) than was required. The flywheel loses this quantity of energy and the speed of the flywheel drops. Now that the crank has moved from p to q, the engine’s work is equal to the area pBbCq, Whereas the energy required is represented by the area pBCq. As a result, the engine has completed more work than was required. Because this extra work (equivalent to the area BbC) is stored in the flywheel, the flywheel’s speed increases as the crank go from p to q.


