Influence Line Diagram: Define, Procedure, Examples, Uses
By BYJU'S Exam Prep
Updated on: September 25th, 2023

An Influence line diagram represents variation in response, shear, moment, or deflection at a specific point as a focused force moves over the member. The ordinates of the Influence line diagram indicate the magnitude of response, shear, moment, or deflection for the corresponding point in a structure.
Once the Influence line diagram is obtained, one can tell where the moving load should be placed on the structure to have the most impact at the top selected location. In this article, we’ll go through how to draw the influence line diagram for a statically determinate and indeterminate structure, determine the absolute maximum shear and moment in a member, etc.
Table of content
What is Influence Line Diagram?
Influence line diagrams are useful in constructing structures that can withstand huge live loads. The theory is used for structures that are subjected to distributed load or a sequence of concentrated forces, including examples of floor girders and bridge trusses.
The Influence Line Diagram is based on how loads or reactions affect the span. It is a diagram that displays the reactions, shear force and bending moments at every segment or instant over any distance over any span you’re interested in learning more about.
Procedure for Influence Line Diagram
The influence line can be created by placing the unit load on the member at a variable position x and then computing the value of reaction, shear, or moment at the point as a function of x.
Influence line diagram for reaction at end A: Place a unit load at distance x from end A and calculate reaction Ay as a function of x.
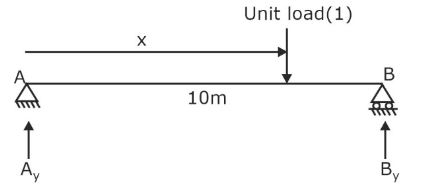
ΣMB = 0, -Ay(10)+(10-x)(1)=0
⟹Ay=1-x/10
| X | Ay |
| 0 | 1 |
| 2.5 | 0.75 |
| 5 | 0.5 |
| 7.5 | 0.25 |
| 10 | 0 |
Similarly, an influence line diagram for reaction at B, shear force at any section, or moment at any section in the simply supported beam can be obtained.
Muller Breslau’s Principle
Heinrich Müller-Breslau devised a method for swiftly developing an influence line’s shape. It states that the influence line diagram of any stress function (reaction, bending moment, shear force) in a structure is represented by its deflected shape, which is derived by eliminating the restraint provided by that stress function and inserting a directly generalized unit displacement in the positive direction. Muller Breslau’s principle determines qualitative ILD for any statically determinate or indeterminate structure.
Influence Line Diagram for Simply Supported Beams
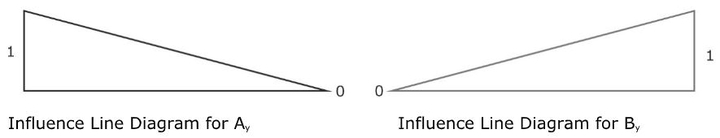
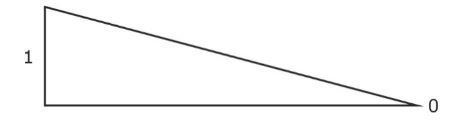
In statically determinate structures, influence line diagrams for reaction, shear force, and bending moment consist of straight lines (first-degree curve). Influence line diagrams for reaction, shear force, and bending moment in a simply supported beam AB are described below.
![]() For reaction at supports A and B
For reaction at supports A and B
- Remove the support whose influence line diagram is to be drawn.
- Provide unit deflection in the positive direction of support reaction.
- Thus, the deflected shape is the influence line diagram for the corresponding reaction force.
- The ordinates of the influence line diagram obtained have no units.
Influence Line Diagram for Cantilever Beams
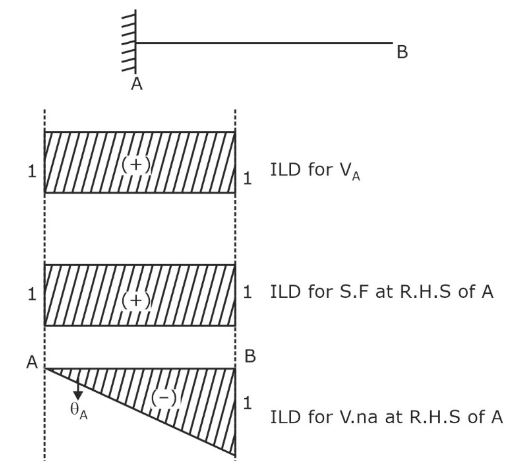
The influence line diagram for cantilever beam AB for reaction, shear force, and bending moment is described below.
- For reaction at fixed support
Remove the support at A without releasing the fixed end moment and apply unit displacement. Then the deflected shape of the beam itself is the influence line diagram for the reaction at A.
- For shear force at a section just to the right of A
Without removing the support at A, assume a vertical shear hinge at the section just to the right of A and apply unit displacement. The deflected shape obtained is the influence line diagram for the shear force.
- For bending moment at A
Assume a hinge at A and apply unit rotation; then, the deflected shape of the beam obtained is the influence line diagram for the bending moment.
Influence Line Diagram for Truss Members
As a unit load moves on the rail, forces in the truss members continuously change. If we plot the force variation in any member, as the unit load moves from one end to the other end of the rail, then it is called the influence line diagram for force in that member.
Influence line diagrams for forces in different members of a truss are shown below:
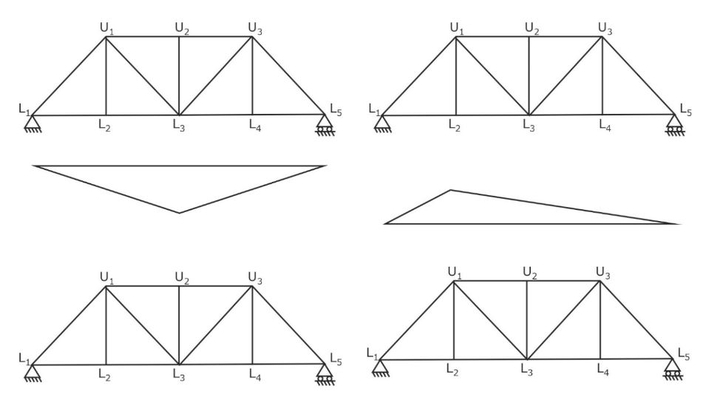
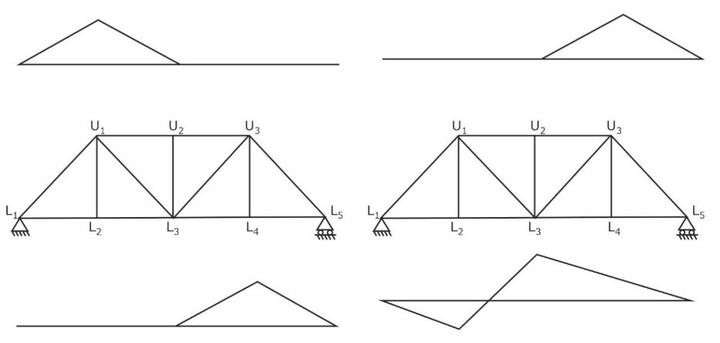
Forces in the upper chord members of the truss are always compressive; such members are called pure compression members whereas forces in the bottom chord members of the truss are always tensile, and such members are called pure tension members.
However, the forces in inclined members of the truss change from compression to tension or from tension to compression. Such members are subjected to a reversal of stresses.
You can have further details in this video:
Influence Line Diagram Solved Examples
Example: Two-wheel loads 10 kN and 20 kN spaced 2 m apart are moving on a simply supported beam, with 10 kN load leading. Determine the maximum reaction at A.
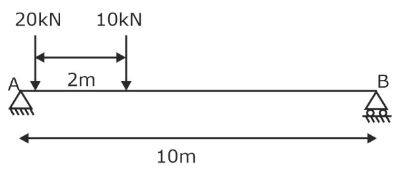
Solution: First, obtain the influence line diagram for reaction at A as per Muller Breslau’s principle.
The second step is determining the load’s position to obtain maximum reaction at support A. Hence, for maximum reaction at A, keep the loads as shown in the figure
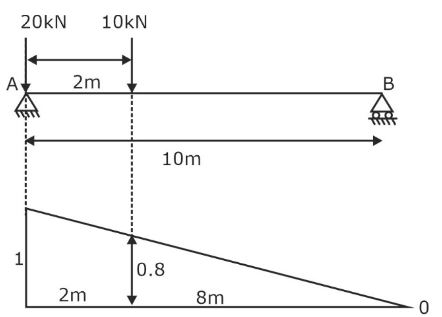 Ordinate under 10 kN load can be obtained by a similar triangle principle, i.e.,
1/10=ordinate under 10 kN/8
⟹ordinate under 10 kN load=0.8
Now, the maximum reaction at A can be calculated as
∴ 20 x 1 + 10 x 0.8 = 28 kN
The above arrangement is considered as when a 10 kN load is placed at A, the reaction obtained is only 10 kN (10×1 = 10kN), which is less than the 28 kN received when the 20 kN load is placed at support A.
Example: A continuous beam is subjected to a moving distributed load of 4 kN/m. Calculate the maximum shear force just to the right of support Q.
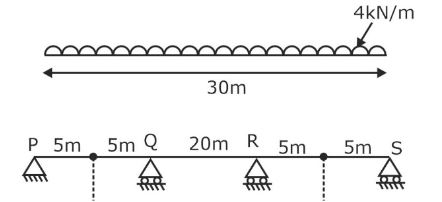
Solution: The influence line diagram for shear force just to the right of Q is given by
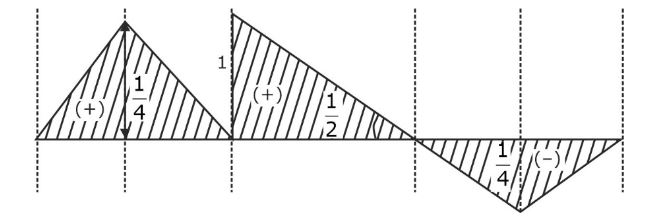
Place the moving load as shown for the maximum shear force at the given section.
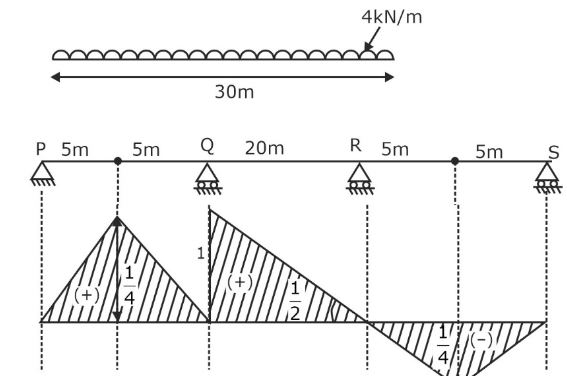
Maximum shear force = area of influence line diagram under the udl = 4(1/2×10×1/4 + 1/2×1×20) = 45 kN
A uniformly distributed load is not placed on section RS because the ordinates of ILD for shear force are harmful to the section. This means that RS is contributing a negative shear force.
- For bending moments at any section
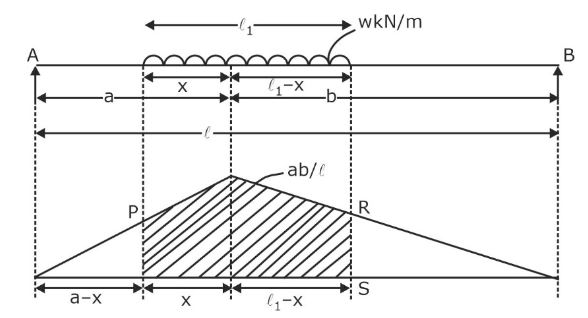
To draw ILD for the bending moment at any section, release the bending moment at that section by introducing a hinge and applying a unit displacement in the positive direction of the moment. The deflected shape of the beam represents the ILD for the bending moment at that section. To apply unit rotation at the hinge assumed at any section, the hinge must be lifted by an amount of ab/L to make θ = 1.
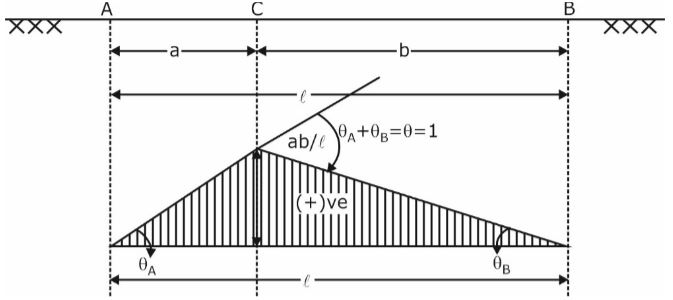
Characteristics of influence line diagram for the shear force at a section: θA=θB=1/length of the span
θA=θB=1
Ordinates of influence line diagram for bending moment are not dimensionless.
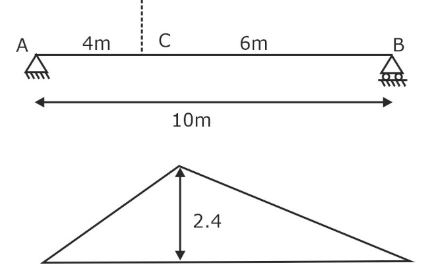
Example: Two-wheel loads of magnitude 10 kN and 5 kN spaced 2 m apart are moving on a simply supported beam of span 10 m. Find the maximum bending moment at a distance 4 m from the left support.
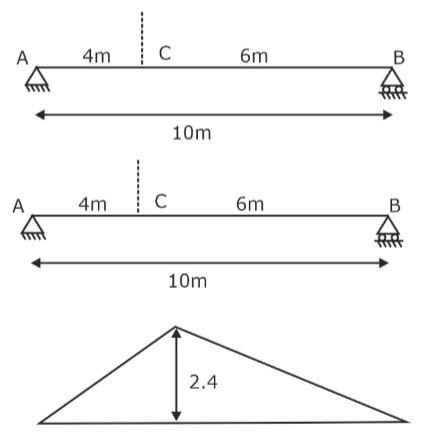
Solution: Influence line diagram for bending moment at section 4 m from the left support can be given as
The loads should be placed as shown in the figure for a maximum bending moment at the given section.
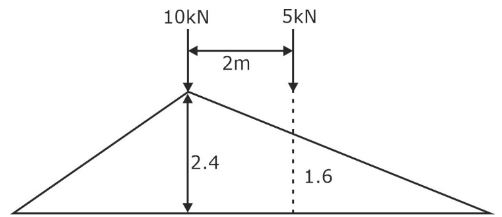
Maximum Bending moment at section C = 10 x 2.4 + 5 x 1.6 = 32 kNm
Note 1: If the udl is shorter than the span is moving on the beam, then to get a maximum bending moment at any section C, keep the udl such that the average load on span AC is equal to the average load on span CB.
The average load is defined as the ratio of load on a particular span to the length of that span.
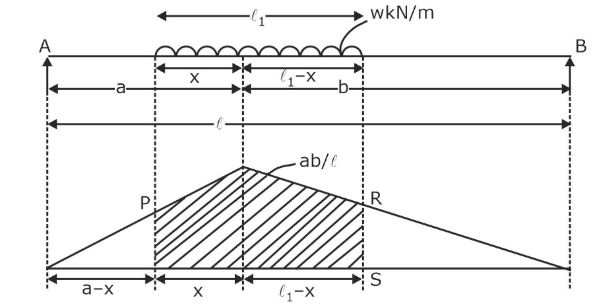
wx/a=w(l1-x)/b
If the above condition is satisfied, then ordinates, if the influence line diagram at the ends of udl will be an equal and maximum area of ILD, is covered under udl.
Example: A uniformly distributed load of intensity 5 kN/m and length 3 m moves on a simply supported beam of span 10 m. Determine the maximum bending moment at a section 4 m from left support.
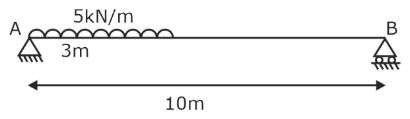 Solution: The influence line diagram for the bending moment at section 4 m from the left support can be given as
For maximum bending at section C, the udl should be placed to cover the maximum area of the influence line diagram obtained. This can be achieved when the udl is placed in a way that the average load on span AC is equal to the average load on span CB.
average load on AC = average load on CB
wx/4= w(3-x)/6
⟹x=1.2 m
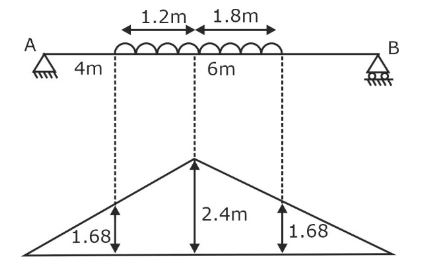
Ordinates at the head and tail of the udl will be the same and can be calculated using a similar triangle principle.
Ordinate under the tail of udl:2.4/4=ordinate under the tail of udl/2.8
Ordinate under tail end = 1.68 m
Now, maximum bending moment at C = 5[1/2(1.68 + 2.4)×1.2 + 1/2(2.4 + 1.68)×1.8]=30.6 kNm
Note 2: If more than two-point loads are moving on the beam, then to get a maximum bending moment at C, keep the loads such that the average load on AC is less than or equal to the average load on CB.
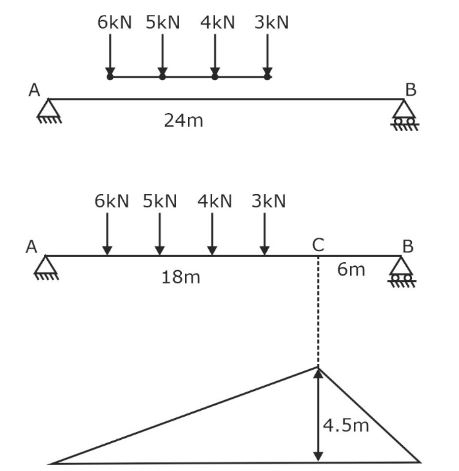
Example: Four-wheel loads 3 kN, 4 kN, 5 kN, and 6 kN spaced 2 m, 3 m, and 3 m apart are moving on a simply supported beam of span 24 m with 3 kN load leading from left to right. To find the maximum bending moment at 18 m from left support, determine the load that must be placed at the section.
Solution: For a maximum bending moment at section 18 m from left support, the loads should be placed such that the average load on AC should be less than or equal to the average load on CB.
|
Description |
Average load on AC |
Average load on CB |
|
When all loads are on AC |
(6+5+4+3)/18=1 |
> 0 |
|
When 3 kN crosses section C |
(6+5+4)/18=0.833 |
> 3/6=0.5 |
|
When 4 kN crosses section C |
(6+5)/18=0.611 |
<(4+3)/6=1.167 |
When a 4 kN load crosses C, the average load on AC is less than the average load on CB. So keep 4 kN at C to get a maximum bending moment at C.
Note 3: When a series of wheel loads are moving on a simply supported beam, then to get a maximum bending moment under a chosen load, keep the loads such that the chosen load and the resultant of all loads are equidistant from the center of the beam. The maximum bending moment occurs under the chosen load but not at the center.
Example: A train of two-point loads of 150 kN and 100 kN, spaced 5 m apart, crosses the beam from left to right with a 100 kN load leading. Determine the maximum sagging bending moment under 150 kN load.
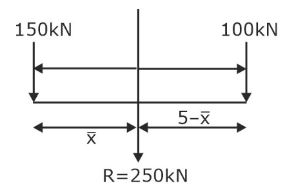
Solution: Here, the section of the beam is not specified. So, we must choose the location of the maximum bending moment. To get the maximum bending moment under a chosen wheel load, the resultant load system and the chosen load must be at an equal distance from the center. Then the maximum bending moment will occur under the chosen wheel load.
Locating the resultant of load system = 150 ∗ 0 + 100 ∗ 5 = 250 ∗ x̄
x̄=2m
Position of load for a maximum bending moment under 150 kN load
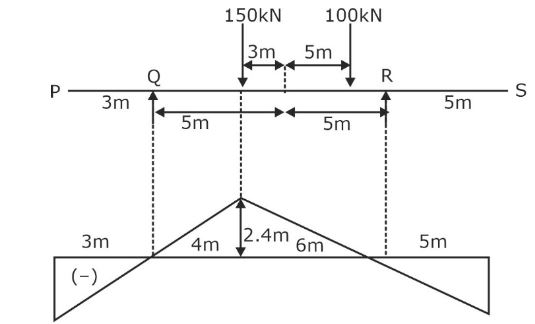
Ordinate under 100 kN load can be calculated using a similar triangle principle, i.e., 2.4/6=ordinate/1
Thus, ordinate under 100 kN load = 0.4 m
Maximum bending moment under 150 kN load = 150 x 2.4 + 100 x 0.4 = 400 kNm
Get complete information about the GATE exam pattern, cut-off, and all those related things on the Byju Exam Prep official youtube channel.