Network Analysis – PERT
By BYJU'S Exam Prep
Updated on: September 25th, 2023

Network analysis is one of the important topics of civil engineering for the GATE exam and other competitive exams. Network analysis can be carried out with many methods like the Bar chart method, Gantt chart method, Milestone method, CPM and PERT. But the most popular and commonly used methods for network analysis are the CPM and PERT.
CPM and PERT are the two different techniques used for the purpose of network analysis. Use of such techniques depends on the type of project. CPM techniques are generally used for repetitive projects, and PERT techniques are used for research-oriented projects. This article contains fundamental notes on the “Network Analysis – PERT” topic of the “Construction Planning and Management” subject.
Table of content
What is Network Analysis?
Network analysis means analyzing a project network that consists of many activities. The activity of a project is a particular task that is required to complete for the completion of the project. Network analysis is mainly carried out by CPM and PERT techniques. PERT stands for the Programme Evaluation Review Technique. And generally used for research-based projects.
Network analysis is a crucial part of project management. With the help of network analysis, the project’s duration, critical activities, float, etc., can be found. Network analysis can be carried out with the help of many methods. These methods are used based on their suitability and use.
Different Methods Used for the Network Analysis
As we know that network analysis is an important part of project management, and it is required to know the different important parameters like duration, critical path, etc. It can be done with the help of different methods. Some of these methods of network analysis are listed below.
- Critical Path Method (CPM)
- Programme Evaluation Review Technique (PERT)
- Milestone chart method
- Bar Chart method
- Gantt Chart method
What is PERT in Network Analysis?
PERT is a tool used for the purpose of network analysis in project management. PERT full form is Programme Evaluation Review Technique. And it is mainly used for the repetitive type of project and is based on the three-time estimate of the activity. The different characteristics of the PERT network are given below.
Programme Evaluation Review Technique (PERT)
- The U.S. Navy developed PERT during the late 1950s to accelerate the development of the Polaris Fleet Ballistic Missile PERT.
- PERT is an abbreviated form for Programme Evaluation and Review Technique used for planning, scheduling and monitoring the project.
- Coordination with the help of PERT was so successful that the entire project was completed years ahead of schedule.
- In PERT, all activity time is probabilistic.
- In the PERT network, an individual activity follows a beta distribution, but the overall project network follows a normal distribution.
Time Estimate
- A project is composed of many diversified activities which contribute to its completion.
- An important characteristic of any project is its duration.
- As its effect and economy are often dependent on the project duration.
- Total project duration depends on the time taken by each activity Estimation of time required for any activity requires wide experience of similar activities.
- The limits with which the duration will lie are estimated.
- PERT follows the probabilistic approach and absorbs the uncertainties into the time estimates for activity and project durations.
- Therefore, PERT is well suited for projects with insufficient or no background information for estimating time duration.
- PERT is used in research projects such as the space industry, defense industry etc. As such, projects are of a non-repetitive type or once-through type for which correct time estimates cannot be made.
- Further, a PERT analysis is event-oriented i.e. in this analysis; interest is more focused on the PERT (start or completion of activity) rather than the activities.
Three kinds of time estimates are made for each activity in PERT to consider the uncertainties involved in the activity times.
(i) Optimistic time (to): If everything in the project goes well.
It is the minimum time required for an activity if everything goes perfectly well without any problems or adverse conditions developed during the execution of the activity.
In this time estimate, no provisions are made for delays or setbacks, and better-than-normal conditions are assumed to prevail during the execution of the activity.
(ii) Most Likely Time (tm): It is the time for completing the best activity.
It is the maximum time required for an activity if everything goes wrong and abnormal situations prevail This time estimate does not include the possible effects of major catastrophes such as floods, earthquakes, fire, labor strikes etc.
(iii) Pessimistic Time (tp): If everything in the project goes wrong.
It is the time required to complete the activity if normal conditions prevail
This time estimate lies between pessimistic and optimistic time estimates
- In PERT, activity time is probabilistic, but activity time is deterministic in CPM.
- The other difference: PERT is Event–Oriented. While the CPM is Activity – Oriented (in CPM, we know the Activity time)
(i) Expected completion time of an Activity (tE)
tE = (to + 4tm + tp)/6
Where, t0 = Optimistic time
tp = Pessimistic time
tm = Most likely time
(ii) Standard deviation of an Activity (𝛔)
𝛔 = (tp – to)/6
(iii) Variance of an activity (𝛔2)
𝛔2 = [(tp – to)/6]2
(iv) Central limit theorem
(a) The mean time of the project as a whole is tE = tE1 + tE2 +…+tEn along the critical path.
The probability of completion of the project in time tE is 50%.
(b) The standard deviation of the project as a whole is σ2 = [σ21+σ22+σ23+…] along the critical path.
Critical Path: The time-wise longest path is called the critical path. In this path, any type of delay, in any event, will cause a delay to the project. These are shown by double lines or dark lines in a network.
An event is critical if its slack is zero.
Event Time
(i) Earliest expected event occurring time (TE)
TjE = TiE + tije When there is only one path.

Where tije = Expected completion time of activity i – j
TjE = (TiE + tije)max when there is more than one path.
Where TiE= Earliest expected time of event i.
TjE= Earliest expected time of event j.
(ii) Latest allowable occurrence time (TL)
TiL = TjL – tije When there is only one path.
TiL = (TjL – tije)min When there is more than one path.
(iii) Slack (s): This is when an event may be delayed without affecting the project’s completion time.

Probability Factor in PERT Chart Analysis
The concept of probability factor (z) in PERT analysis is used to estimate the completion time of a project for a particular value of the probability. These estimates have been done based on the concept of normal distribution. It can be explained in the following way.
z = (TS – TE)/σ
Where, TS = Given scheduled completion time of the project
TE = Expected completion time of the project.
σ = Standard deviation
| Probability Factor (z) | Probability (p) in % |
| 0 | 50 |
| +1 | 84.13 |
| +2 | 97.72 |
| +3 | 99.87 |
| -1 | 15.87 |
| -2 | 2.28 |
| -3 | 0.13 |
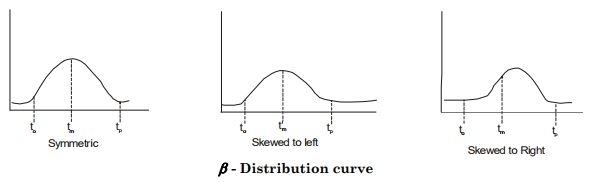
Frequency Distribution Curve for PERT
It is assumed to be a β – distribution curve with a unimodal point at tm and its endpoints at to and tp. The most likely time need not be the midpoint of to and tp; hence, the frequency distribution curve may be skewed to the left, skewed to the right or symmetric.
*****
If you are preparing for ESE/ GATE or other PSU Exams (Civil Engineering), then avail Online Classroom Program for ESE and GATE CE.
Online Classroom Program for ESE/GATE CE
You can avail of BYJU’S Exam Prep Test Series, specially designed for all Civil Engineering Exams.