
Tips to Solve Mixed Graph Data Interpretation (DI) Questions
By BYJU'S Exam Prep
Updated on: September 25th, 2023

We are here with very interesting tricks to solve Mixed Chart Questions in Data Interpretation so that you can solve these questions including Pie Chart and Data Table, Data Table and Line Graph, Bar Graph and Line Graph, Pie Chart and Line Graph, & Pie Chart and Pie Chart which are majorly asked in all the bank exams.
Hence, solving Mixed Chart Questions is not difficult anymore because the expert has given the easiest method and tricks to solve the problems. In this article, we have come up with important tips and tricks to solve the Mixed Graph Questions in Data Interpretation for all Bank exams.
Table of content

Important Tips & Tricks to Solve Mixed Graph Questions in DI
The aspirants can use these methods to solve the questions which consist of pie charts, bar graphs, or line graphs in a single question. It might seem tough and complicated but after practicing with the expert’s tricks, you won’t ever fear solving Mixed Graphs problems in any bank exam.
Sample Mixed Graph Questions:
1. Direction: Study the given data carefully and answer the following questions.
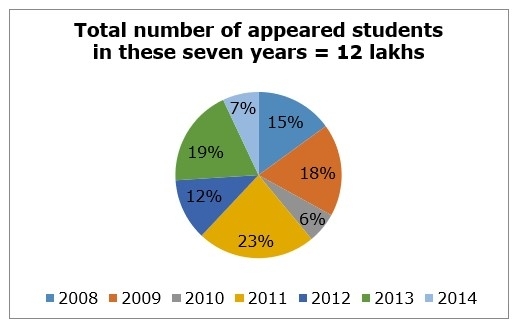
The given below pie chart shows the percentage distribution of students who appeared in a competitive exam for seven consecutive years.
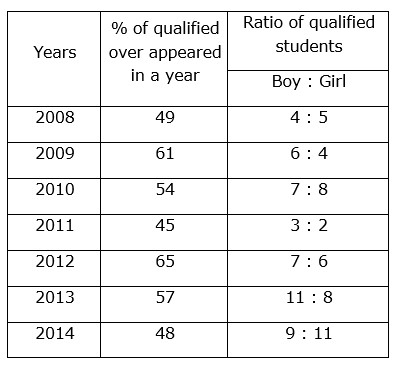
The table shows the percentage of students qualified each year and the ratio of boys and girls of qualified students.
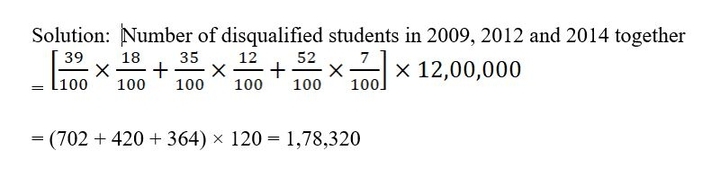
1. What is the total number of candidates disqualified in the years 2009, 2012, and 2014 together?
A. 168320
B. 172320
C. 178320
D. 188230
E. 178120
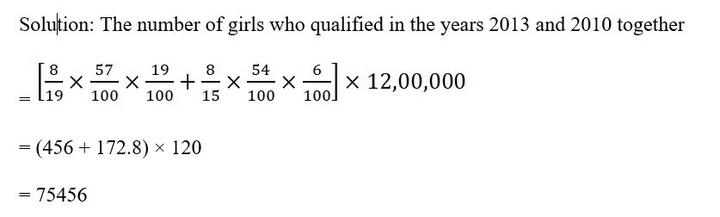
2. What is the total number of girls who qualified in the years 2013 and 2010 together?
A. 75456
B. 55456
C. 85456
D. 72456
E. 65456
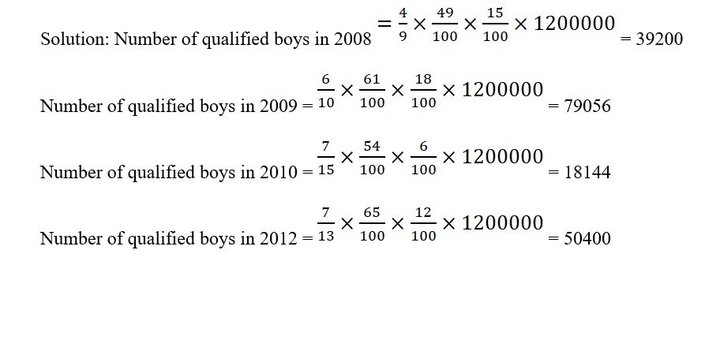
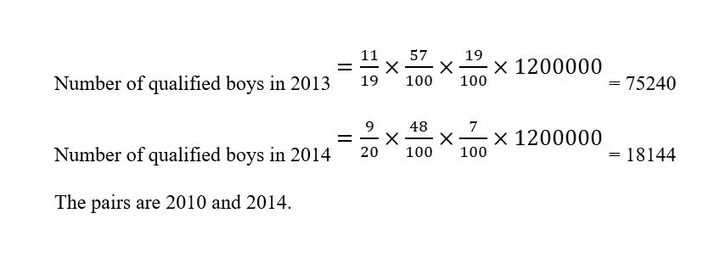
3. Which of the following pair of years have an equal number of qualified boys?
A. 2009 and 2013
B. 2010 and 2012
C. 2010 and 2014
D. 2008 and 2012
E. None of these
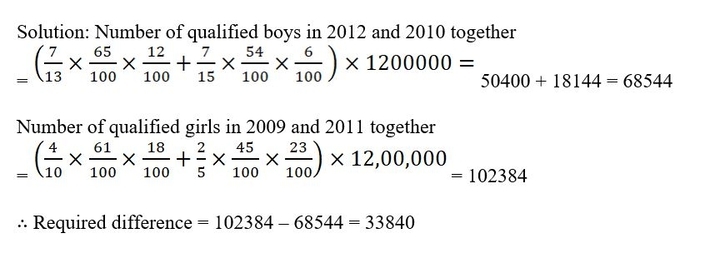
4. Find the difference between several qualified boys in the years 2012 and 2010 together and the number of qualified girls in the years 2009 and 2011 together.
A. 36840
B. 33000
C. 32840
D. 33840
E. None of these
Direction: Study the given data carefully and answer the following questions.
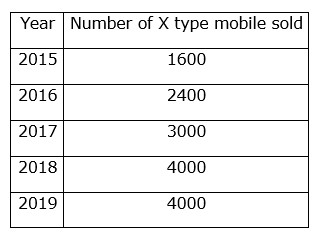
The given below bar graph shows the difference between the number of X-type mobiles and Y-type mobiles sold in five different years.
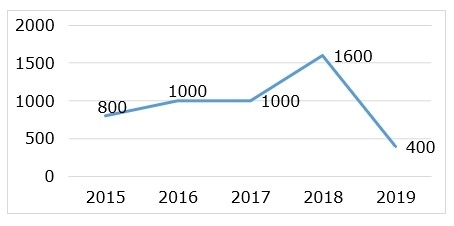
The given below table shows the total number of X-type mobiles sold in the same five years.
1. The ratio of the number of blue Y-type mobile and black Y-type mobiles sold in 2016 was 2 : 3, respectively. The number of Y-type mobiles of other colors sold in 2016 was 600. Find the number of black Y-type mobiles sold in 2016.
A. 350
B. 480
C. 400
D. 550
E. None of these
Solution: The number of X type mobiles sold in 2015 = 1600
Number of X type mobiles sold in 2015 – number of Y type mobiles sold in 2015 = 800
Number of Y type mobiles sold in 2015 = 1600 – 800 = 800.
Similarly,
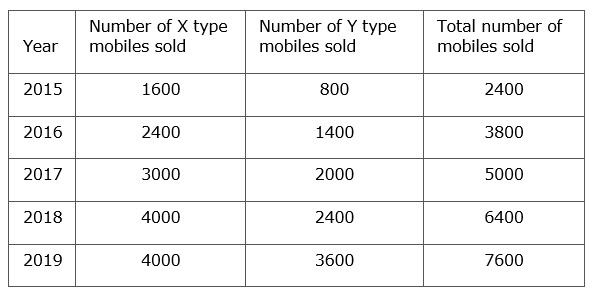
Total number of black and blue Y type mobiles sold in 2016 = 1400 – 600 = 800
Therefore, the number of black Y type mobiles sold in 2016 = 800 X 3/5
2. What is the average number of Y-type mobiles sold in 2015, 2016, and 2017?
A. 1400
B. 1200
C. 1000
D. 800
E. 1600
Solution: The number of X type mobiles sold in 2015 = 1600
Number of X type mobiles sold in 2015 – number of Y type mobiles sold in 2015 = 800
Number of Y type mobiles sold in 2015 = 1600 – 800 = 800.
Similarly,

Difference between the number of mobiles sold = Number of X type mobiles sold – Number of Y type mobiles sold.
Direction: Study the following data carefully and answer the given questions.
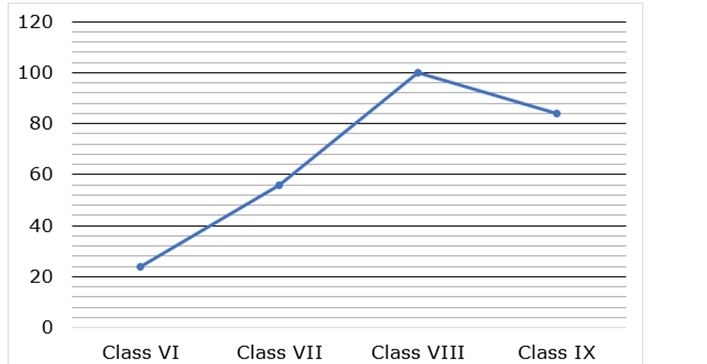
The given below line chart shows the number of boys in four different classes in a school.
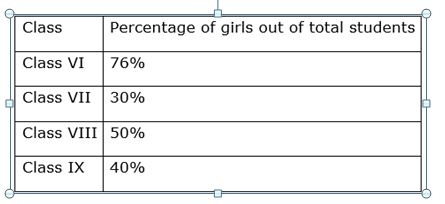
The given below table shows the percentage of girls out of the total number of students in these classes.
The total number of girls in Class VI and Class VII together is how much less than the total number of girls in Class VIII and Class IX together?
A. 56
B. 84
C. 80
D. 92
E. 66
Answer. A
Solution.
Total number of girls in Class VI = 24 X 76/24 = 76
Total number of girls in Class VII = 56 X 30/70 = 24
Total number of girls in Class VIII = 100 X 50/50 = 100
Total number of girls in Class IX = 84 X 40/60 = 56
Required difference = 100 + 56 – (76 + 24) = 156 – 100 = 56
1. Total number of students in Class IX is what percent more/less than the total number of students in Class VI?
A. 50% more
B. 30% less
C. 40% more
D. 60% less
E. 55% more
Answer. C
Solution.
Total number of students in Class IX = 84 X 100/60 = 140
Total number of students in Class VI = 24 X 100/24 = 100
Required percentage = ((140 – 100)/100) X 100 = 40% more
2. a Total number of boys in Class V is 25% more than the total number of boys in Class VII, while the total number of girls in Class V is 40% more than the total number of students in Class VIII. Find the total number of students in Class V.
A. 350
B. 270
C. 375
D. 450
E. 225
Answer. A
Solution-
Total number of boys in Class V = 125÷100 X 56 = 70
Total number of girls in Class V = 140÷100 X 100 X 100 ÷ 50 = 280
Total number of students in Class V = 280 + 70 = 350
3. What is the ratio of the total number of students in Class IX to the total number of girls in Class VI and Class VII together?
A. 10:9
B. 7:4
C. 4:3
D. 7:5
E. 8:5
Answer. D
Solution: Total number of students in Class IX = 84 X 100 ÷ 60 = 140
Total number of girls in Class VI and Class VII together = 24 X (76/24) + 56 X (30/70) = 100
Required ratio = 140 : 100 = 7 : 5
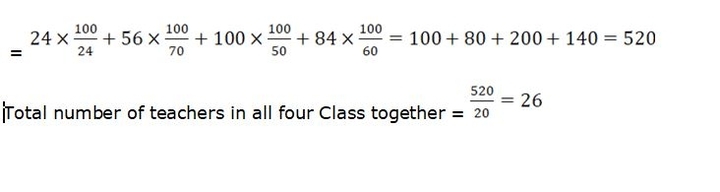
4. There is one teacher per 20 students in a Class. Find the total number of teachers in all four classes together.
A. 36
B. 18
C. 42
D. 32
E. 26
Answer. E
Solution.
Total number of students in the four Classes together =
If you are aiming to clear SBI/IBPS Exams 2023, then join the Online Classroom Program where you will get:
- Live Courses by Top Faculty
- Daily Study Plan
- Comprehensive Study Material
- Latest Pattern Test Series
- Complete Doubt Resolution
- Regular Assessments with Report Card
Click here to access Bank Test Series
Why BYJU’S Exam Prep Test Series?
- Get better at every level of your preparation with unlimited test series, based on the latest exam pattern.
- Assess areas of weaknesses & track improvements with in-depth performance analysis
Download the BYJU’S Exam Prep App Now.
The most comprehensive exam prep app.


