DI-Pie Charts Quiz
Attempt now to get your rank among 2 students!
Question 1
A math teacher has a question bank of five topics (Profit & Loss, Percentages, Ratio & Proportion, Time & Work, and Time, Speed & Distance). The questions are divided into three categories depending on their difficulty level, with 40 questions each of Hard (Outer-most pie) & Easy category (inner-most pie) & 80 questions of Moderate category.

A test is to be made using all of the easy and hard level questions only from its question bank. In how many ways the test can be made if no two easy questions are set next to each other?
Question 2
A math teacher has a question bank of five topics (Profit & Loss, Percentages, Ratio & Proportion, Time & Work, and Time, Speed & Distance). The questions are divided into three categories depending on their difficulty level, with 40 questions each of Hard (Outer-most pie) & Easy category (inner-most pie) & 80 questions of Moderate category.
Question 3
A math teacher has a question bank of five topics (Profit & Loss, Percentages, Ratio & Proportion, Time & Work, and Time, Speed & Distance). The questions are divided into three categories depending on their difficulty level, with 40 questions each of Hard (Outer-most pie) & Easy category (inner-most pie) & 80 questions of Moderate category.
Question 4
A retailer purchased shirts of 7 brands, namely, Brand A, Brand B, Brand C, Brand D, Brand E, Brand F and Brand G. The below pie chart gives the distribution of the purchase of shirts of these brands:

Total purchase cost = Rs 30 lakh
The below table shows the purchase price per shirt of the brands and the percent profit made on selling them. The cost price and selling price of each shirt of all brands is constant. All shirts purchased by him were sold.

What is the difference between the selling price of brand B and brand G shirt?
Question 5
A retailer purchased shirts of 7 brands, namely, Brand A, Brand B, Brand C, Brand D, Brand E, Brand F and Brand G. The below pie chart gives the distribution of the purchase of shirts of these brands:
Total purchase cost = Rs 30 lakh
The below table shows the purchase price per shirt of the brands and the percent profit made on selling them. The cost price and selling price of each shirt of all brands is constant. All shirts purchased by him were sold.
Question 6
A retailer purchased shirts of 7 brands, namely, Brand A, Brand B, Brand C, Brand D, Brand E, Brand F and Brand G. The below pie chart gives the distribution of the purchase of shirts of these brands:
Total purchase cost = Rs 30 lakh
The below table shows the purchase price per shirt of the brands and the percent profit made on selling them. The cost price and selling price of each shirt of all brands is constant. All shirts purchased by him were sold.
Question 7
A retailer purchased shirts of 7 brands, namely, Brand A, Brand B, Brand C, Brand D, Brand E, Brand F and Brand G. The below pie chart gives the distribution of the purchase of shirts of these brands:
Total purchase cost = Rs 30 lakh
The below table shows the purchase price per shirt of the brands and the percent profit made on selling them. The cost price and selling price of each shirt of all brands is constant. All shirts purchased by him were sold.
Question 8
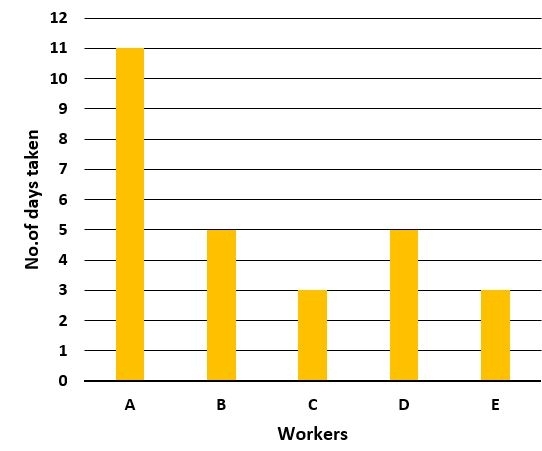
The Bar-chart given below shows the time taken by each worker to complete a certain amount of work.
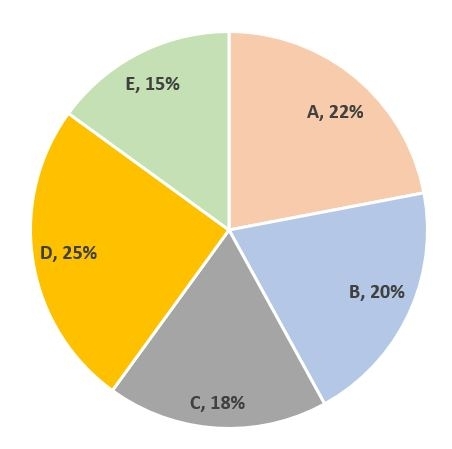
The Pie-chart given below shows the percentage of work done by the given 5 workers in the time-period given in the above bar-chart.
Question 9
The Bar-chart given below shows the time taken by each worker to complete a certain amount of work.
The Pie-chart given below shows the percentage of work done by the given 5 workers in the time-period given in the above bar-chart.
Question 10
The Bar-chart given below shows the time taken by each worker to complete a certain amount of work.
The Pie-chart given below shows the percentage of work done by the given 5 workers in the time-period given in the above bar-chart.
- 2 attempts
- 0 upvotes
- 0 comments

