Time Left - 10:00 mins
Data Interpretation Quiz
Attempt now to get your rank among 2 students!
Question 1
The following pie diagram gives the marks scored by a student in different subjects- English, Hindi, mathematics, science and social science in an examination. Assuming that the total marks obtained for the examination are 540, answer the question
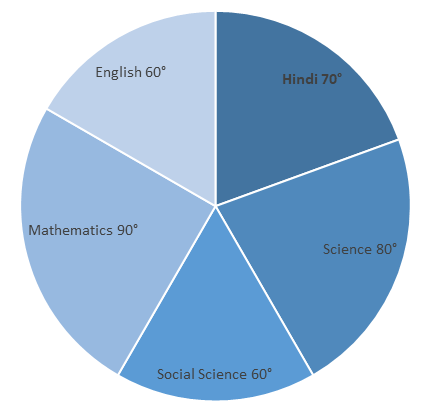
The marks scored is English, Science and Social science exceed the marks scored in Hindi and Mathematics by
Question 2
The following pie diagram gives the marks scored by a student in different subjects- English, Hindi, mathematics, science and social science in an examination. Assuming that the total marks obtained for the examination are 540, answer the question
The subject in which the student scored 105 marks is
Question 3
The following pie diagram gives the marks scored by a student in different subjects- English, Hindi, mathematics, science and social science in an examination. Assuming that the total marks obtained for the examination are 540, answer the question
The difference of marks between English and Science is the same as between
Question 4
The following pie diagram gives the marks scored by a student in different subjects- English, Hindi, mathematics, science and social science in an examination. Assuming that the total marks obtained for the examination are 540, answer the question
The marks scored in Hindi and Mathematics exceed the marks scored in English and Social science by
Question 5
Direction: The table given below shows the percentage of literate people in 6 cities. This table also shows the ratio of males to females among literate people.

% of literate people of any city
= (Literate people of the city / Total population of the city) × 100
% of literate people of any city
= (Literate people of the city / Total population of the city) × 100
If the total population of City 4 is 600000, then how many literate people are there in city 4
Question 6
Direction: The table given below shows the percentage of literate people in 6 cities. This table also shows the ratio of males to females among literate people.
% of literate people of any city
= (Literate people of the city / Total population of the city) × 100
% of literate people of any city
= (Literate people of the city / Total population of the city) × 100
Total population of city 6 is 200000 and the total population of City 2 is 220000. What is the respective ratio of literate males of City 2 and literate females of City 6?
Question 7
Direction: The table given below shows the percentage of literate people in 6 cities. This table also shows the ratio of males to females among literate people.
% of literate people of any city
= (Literate people of the city / Total population of the city) × 100
% of literate people of any city
= (Literate people of the city / Total population of the city) × 100
If there are 259210 literate females in City 5, then what is the total population of City 5?
Question 8
Direction: The table given below shows the percentage of literate people in 6 cities. This table also shows the ratio of males to females among literate people.
% of literate people of any city
= (Literate people of the city / Total population of the city) × 100
% of literate people of any city
= (Literate people of the city / Total population of the city) × 100
The population of 6 cities are 250000, 200000, 220000, 300000, 150000 and 400000 respectively. Which is the correct order of the number of literate people in these cities?
Question 9
The line graph shows the record of number of admissions to a certain coaching centre from 2011 to 2016. Study the diagram and answer the following questions.
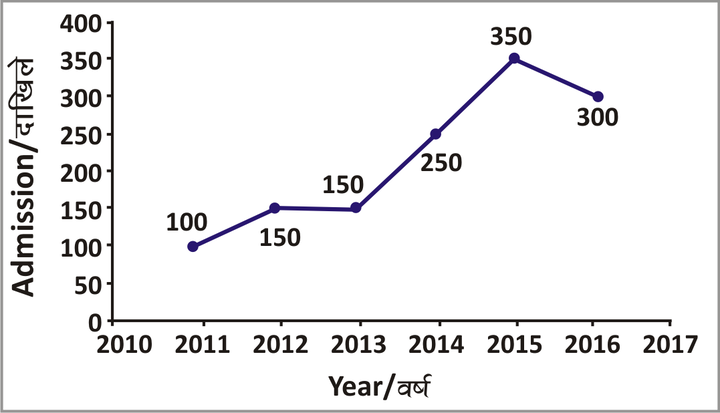
In how many years was the number of admissions greater than that of the previous year?
Question 10
The line graph shows the record of number of admissions to a certain coaching centre from 2011 to 2016. Study the diagram and answer the following questions.
Ignoring year 2016 how many students took admission in the coaching centre since its inception in the year 2011?
- 2 attempts
- 0 upvotes
- 0 comments
Dec 28IPM, CUET & BBA Exams

