Time Left - 10:00 mins
Data Interpretation Quiz
Attempt now to get your rank among 8 students!
Question 1
Direction: The following bar graph shows the sales (in thousands) of motor bikes by the factories, F1, F2, F3 and F4 in 2017, 2018 and 2019
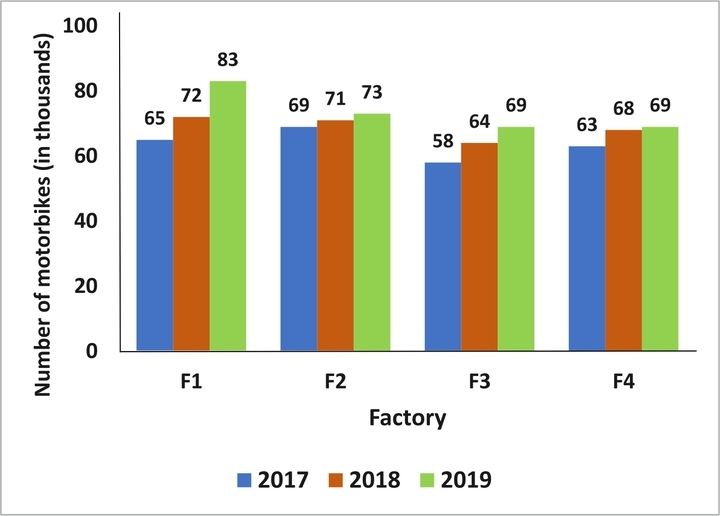
Which of the factories witnessed the highest increase in the percentage of sales from 2018 to 2019?
Question 2
Direction: The following graph represents the salary, expenditure, tax and savings (in rupees) per month of the persons A, B, C and D per month.
Study the graph and answer the question.
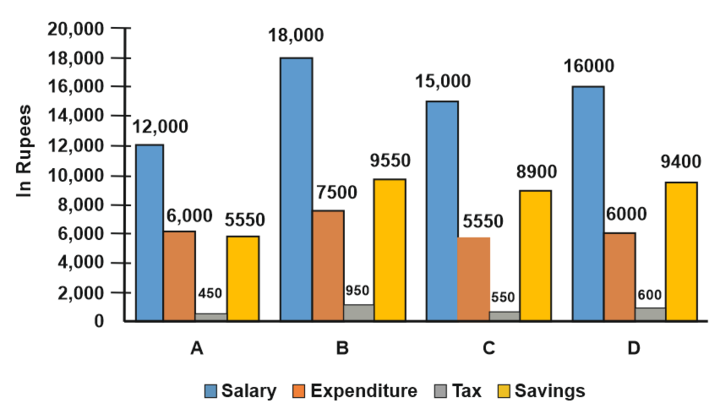
The expenditure as a percentage of salary is the least for:
Question 3
Direction: In the below questions the given pie chart shows the number of students admitted in different faculties of an engineering college. Study the chart and answer the questions.

Find the number of students more in computer science branch than in Bio-Tech. If 625 students are in Civil branch?
Question 4
Direction: The following bar graph shows the sales (in thousands) of motor bikes by the factories, F1, F2, F3 and F4 in 2017, 2018 and 2019
What is the ratio of total sales of F1 to that of F4 across all years?
Question 5
Direction: The following graph represents the salary, expenditure, tax and savings (in rupees) per month of the persons A, B, C and D per month.
Study the graph and answer the question.
The tax as a percentage of salary is highest in case of:
Question 6
Direction: In the below questions the given pie chart shows the number of students admitted in different faculties of an engineering college. Study the chart and answer the questions.
If 625 students are in Civil branch then find the ratio of students in Law and computer science branch?
Question 7
Direction: The following bar graph shows the sales (in thousands) of motor bikes by the factories, F1, F2, F3 and F4 in 2017, 2018 and 2019
Which factory had the least number of sales across all the years?
Question 8
Direction: The following graph represents the salary, expenditure, tax and savings (in rupees) per month of the persons A, B, C and D per month.
Study the graph and answer the question.
Tax as the percentage of salary is least in case of:
Question 9
Direction: The following bar graph shows the sales (in thousands) of motor bikes by the factories, F1, F2, F3 and F4 in 2017, 2018 and 2019
Which factory had the highest sales across all the years?
Question 10
Direction: The following graph represents the salary, expenditure, tax and savings (in rupees) per month of the persons A, B, C and D per month.
Study the graph and answer the question.
Savings as a percentage of salary is highest in case of:
- 8 attempts
- 0 upvotes
- 0 comments
Jun 30IPM, CUET & BBA Exams

