Time Left - 10:00 mins
Bar Chart Quiz
Attempt now to get your rank among 2 students!
Question 1
Direction: Study the following bar graph carefully and answer the questions given below.
The given below bar graph shows the quantity (in kg) of Rice, wheat and sugar consumed by various restaurants over a year.
The given below bar graph shows the quantity (in kg) of Rice, wheat and sugar consumed by various restaurants over a year.
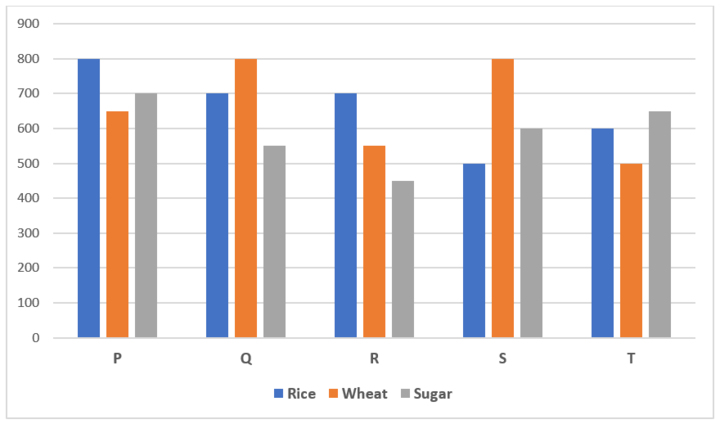
What is the respective ratio of the total quantity of rice, wheat and sugar consumed by restaurant R to the total quantity of rice, wheat and sugar consumed by restaurant T?
Question 2
Direction: Study the following bar graph carefully and answer the questions given below.
The given below bar graph shows the quantity (in kg) of Rice, wheat and sugar consumed by various restaurants over a year.
The given below bar graph shows the quantity (in kg) of Rice, wheat and sugar consumed by various restaurants over a year.
What is the total quantity of rice, wheat and sugar consumed by all the restaurant?
Question 3
Direction: Study the following bar graph carefully and answer the questions given below.
The given below bar graph shows the quantity (in kg) of Rice, wheat and sugar consumed by various restaurants over a year.
The given below bar graph shows the quantity (in kg) of Rice, wheat and sugar consumed by various restaurants over a year.
Wheat consumed by restaurant S is approximately what percent of rice and sugar consumed by the same restaurant?
Question 4
Direction: Study the following bar graph carefully and answer the questions given below.
The given below bar graph shows the quantity (in kg) of Rice, wheat and sugar consumed by various restaurants over a year.
The given below bar graph shows the quantity (in kg) of Rice, wheat and sugar consumed by various restaurants over a year.
Sugar consumed by restaurant Q is approximately what percent of the sugar consumed by all the restaurant together?
Question 5
Direction: Study the following bar graph carefully and answer the questions given below.
The given below bar graph shows the quantity (in kg) of Rice, wheat and sugar consumed by various restaurants over a year.
The given below bar graph shows the quantity (in kg) of Rice, wheat and sugar consumed by various restaurants over a year.
What is the difference between the average quantity of wheat and the average quantity of sugar consumed by all the restaurant together?
Question 6
Directions: A dairy received milk from 5 farmers, A, B, C, D and E. Each of the farmers supplied 60 litres of milk to the dairy. The below table gives the ratio of water and milk in the milk supplied by the farmers.

The milk collected at the dairy was given to seven distributors namely, J, K, L, M, N, O and P. The below bar graph shows the volume of milk from different farmers that was given to each of the distributors.

It is also known that distributor J was given 10 liters of milk by each of the farmers.
The milk collected at the dairy was given to seven distributors namely, J, K, L, M, N, O and P. The below bar graph shows the volume of milk from different farmers that was given to each of the distributors.
It is also known that distributor J was given 10 liters of milk by each of the farmers.
What is the percentage of pure milk received by P?
Question 7
Directions: A dairy received milk from 5 farmers, A, B, C, D and E. Each of the farmers supplied 60 litres of milk to the dairy. The below table gives the ratio of water and milk in the milk supplied by the farmers.
The milk collected at the dairy was given to seven distributors namely, J, K, L, M, N, O and P. The below bar graph shows the volume of milk from different farmers that was given to each of the distributors.
It is also known that distributor J was given 10 liters of milk by each of the farmers.
The milk collected at the dairy was given to seven distributors namely, J, K, L, M, N, O and P. The below bar graph shows the volume of milk from different farmers that was given to each of the distributors.
It is also known that distributor J was given 10 liters of milk by each of the farmers.
How many distributors received milk that was at least 75% pure?
Question 8
Directions: A dairy received milk from 5 farmers, A, B, C, D and E. Each of the farmers supplied 60 litres of milk to the dairy. The below table gives the ratio of water and milk in the milk supplied by the farmers.
The milk collected at the dairy was given to seven distributors namely, J, K, L, M, N, O and P. The below bar graph shows the volume of milk from different farmers that was given to each of the distributors.
It is also known that distributor J was given 10 liters of milk by each of the farmers.
The milk collected at the dairy was given to seven distributors namely, J, K, L, M, N, O and P. The below bar graph shows the volume of milk from different farmers that was given to each of the distributors.
It is also known that distributor J was given 10 liters of milk by each of the farmers.
What is the volume of water in the milk received by O?
Question 9
Directions: A dairy received milk from 5 farmers, A, B, C, D and E. Each of the farmers supplied 60 litres of milk to the dairy. The below table gives the ratio of water and milk in the milk supplied by the farmers.
The milk collected at the dairy was given to seven distributors namely, J, K, L, M, N, O and P. The below bar graph shows the volume of milk from different farmers that was given to each of the distributors.
It is also known that distributor J was given 10 liters of milk by each of the farmers.
The milk collected at the dairy was given to seven distributors namely, J, K, L, M, N, O and P. The below bar graph shows the volume of milk from different farmers that was given to each of the distributors.
It is also known that distributor J was given 10 liters of milk by each of the farmers.
Had L was given 10 liters of milk from the farmers he received 5 liters and vice versa, what would have been the purity of milk received by L?
Question 10
Directions: A dairy received milk from 5 farmers, A, B, C, D and E. Each of the farmers supplied 60 litres of milk to the dairy. The below table gives the ratio of water and milk in the milk supplied by the farmers.
The milk collected at the dairy was given to seven distributors namely, J, K, L, M, N, O and P. The below bar graph shows the volume of milk from different farmers that was given to each of the distributors.
It is also known that distributor J was given 10 liters of milk by each of the farmers.
The milk collected at the dairy was given to seven distributors namely, J, K, L, M, N, O and P. The below bar graph shows the volume of milk from different farmers that was given to each of the distributors.
It is also known that distributor J was given 10 liters of milk by each of the farmers.
N gave half of the milk he had received to K. How much water (by volume) does K’s milk now contain?
- 2 attempts
- 0 upvotes
- 0 comments
Jul 7IPM, CUET & BBA Exams

