Master Part A CSIR 2021 || DI Special Quiz (02.12.2021)
Attempt now to get your rank among 43 students!
Question 1
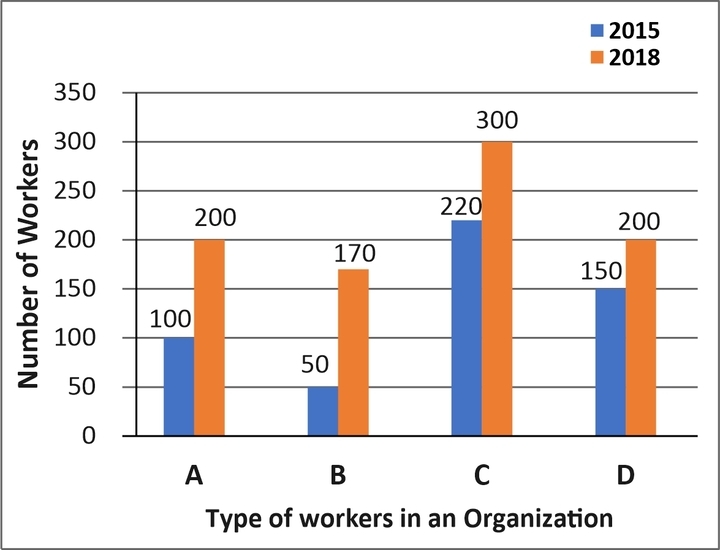
The percentage increase in the number of workers in 2018 is maximum as compared to that in 2015 case of workers of type:
Question 2
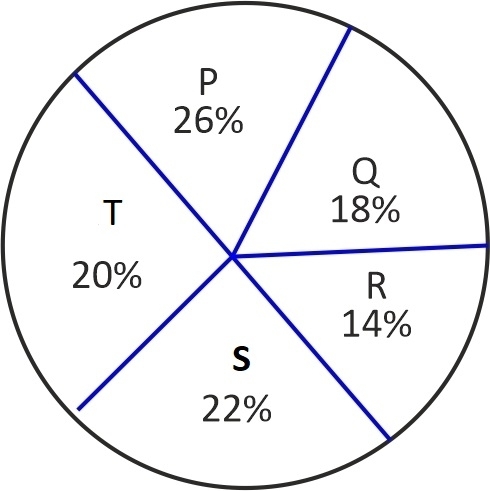
Find the average number of students in schools R and S together.
Question 3

The number of deaths in 2016 were less than that of year 2012 by _____%.
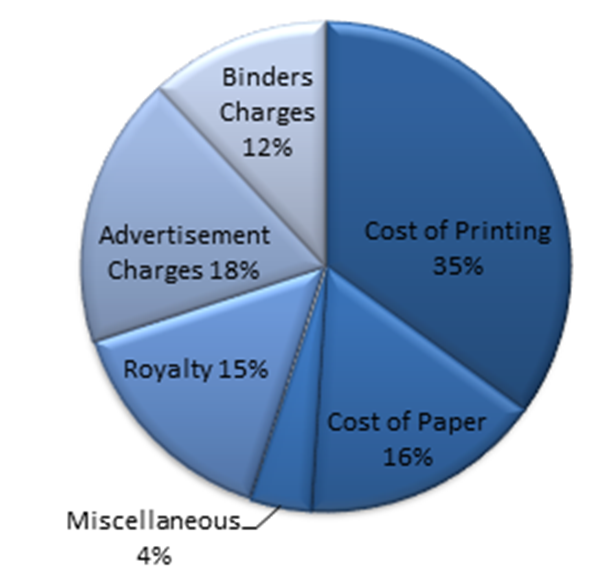
Question 4
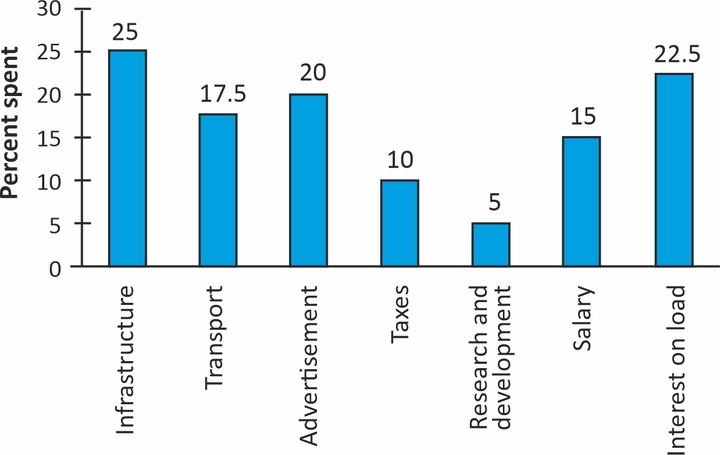
The total expenditure of the company is how many times the total expenditure on 'Research and Development' and 'Salary'?
Question 5
If the imports in 2016 were Rs. 250 million and the total exports in the years 2016 and 2017 together were Rs. 500 million, then the imports in 2017 were:
Question 6

In which year were number of vacancies lesser than that of the previous year?
Question 7
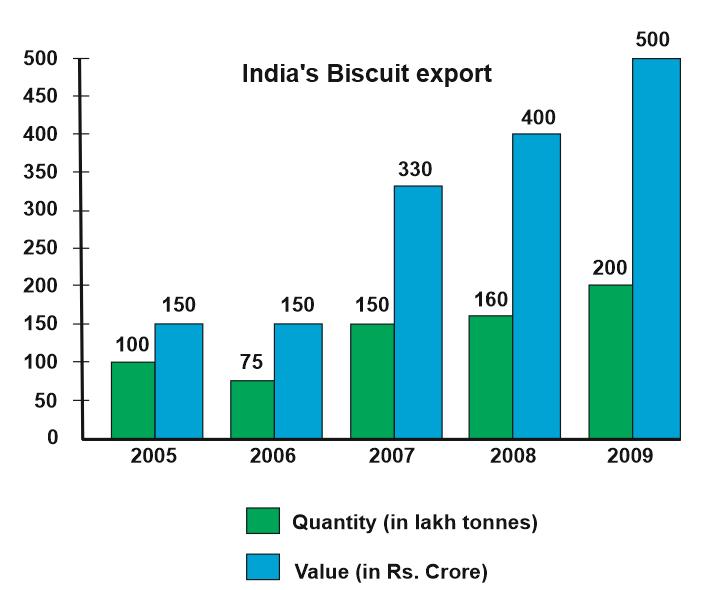
What was the percentage drop in the export quantity from 2005 to 2006?
Question 8
Question 9
There are 50 students of R.S. Public School to be selected for cricket team. Out of 50 students 10 are selected for Test team, 25 are selected for T-20 team and 15 got selected in one day match team. In which 5 are selected both in Test team and T-20 team, 10 are selected both in T-20 team and one day team and 4 are selected both in Test team and one day team. Also 1 student is selected in all three teams. Based on this data, answer the following questions:
How many students out of 50 are not selected in any team?
Question 10
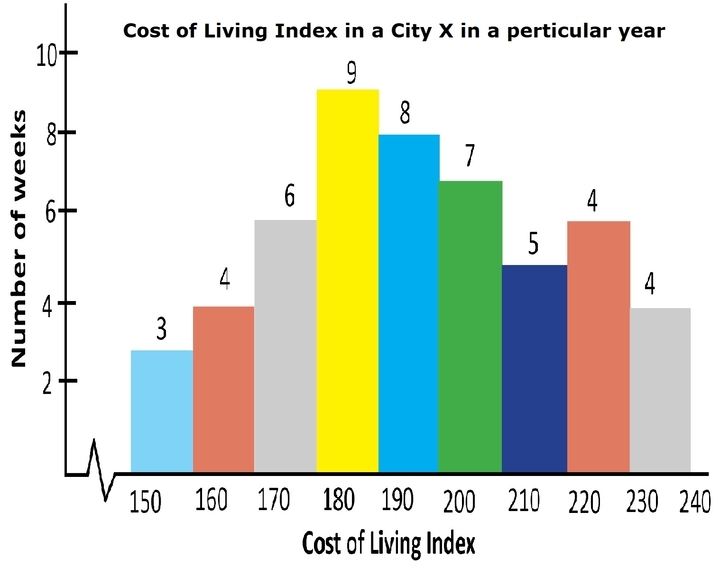
The number of weeks, in which the cost-of-living index was 160 or more but less than 190, is approximately what percent more than the number of weeks in which the cost-of-living index was 200 or more but less than 220 (correct to one decimal place)?
- 43 attempts
- 0 upvotes
- 0 comments

