CSIR NET 2022 || General Aptitude || DI Special Quiz (27.01.2022)
Attempt now to get your rank among 46 students!
Question 1
Study the graph and answer question.
The ratio of imports in 2014, 2016 and 2017 of the country to the total exports in 2015 and 2016 is:
Question 2
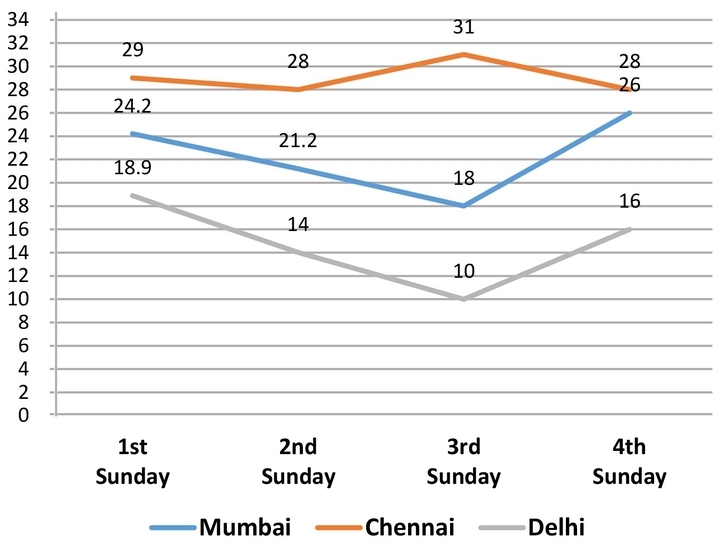
In the line-graph, the temperature of four Sundays of three cities is shown.
In the line-graph, when was the maximum temperature recorded in Delhi?
Question 3
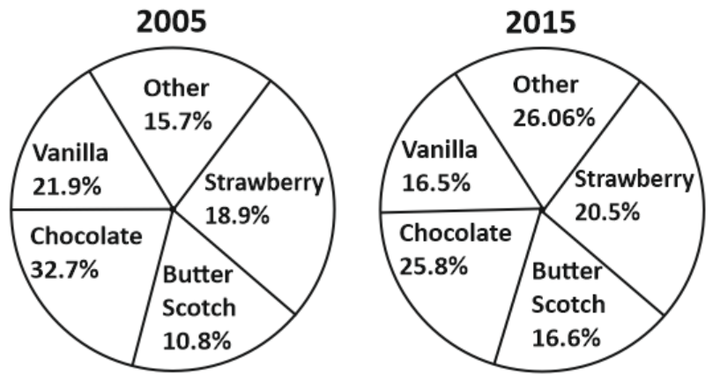
Direction: The given pie charts represent the popularity of ice-cream flavours in the years 2005 and 2015
If a percentage point shift results in annual additional sales of₹5,000, how much (in₹),did the combined annual strawberry' and butterscotch sales increase from 2005 to 2015?
Question 4
The table given below shows the income and expenditure (in Rs) of two companies A and B from 2012 to 2016. Also, Profit = Income – Expenditure and Profit% = [(Income – Expenditure)/Expenditure]X100
What is the ratio of profit of A in year 2013 and profit of B in year 2016 respectively?
Question 5
Direction:Answer the questions based on the given line graph. Ratio of Exports to Imports (in terms of money in Rs. crores) of Two Companies Over the Years
In how many of the given years were the exports more than the imports for Company A?
Question 6
The table given below shows the number of students studying in five colleges in the given five years.
If in years 2011, in college N, 80% of the total students appeared in a exam, out of which 50% students passed, then how many students passed the exam?
Question 7
The line graph shows Net exports in million USD of a certain country (Net exports = Exports – Imports). Study the diagram and answer the following questions.
In how many years were the net exports more than that of the previous year?
Question 8
In the Pie chart, the taxable incomes of A, B, C and D in lakhs are shown.
This chart shows the paid taxes (in lakhs) by A, B, C and D against their payable taxes.
In the given pie-chart, if tax payable income of B was 12% more, then what tax was paid by him(in lakhs)?
Question 9
In the line graph, the temperature of four Sundays of three cities is shown.
In the given line-graph, what was the average temperature in three cities on third Sunday? (Calculate up to first decimal place)
Question 10
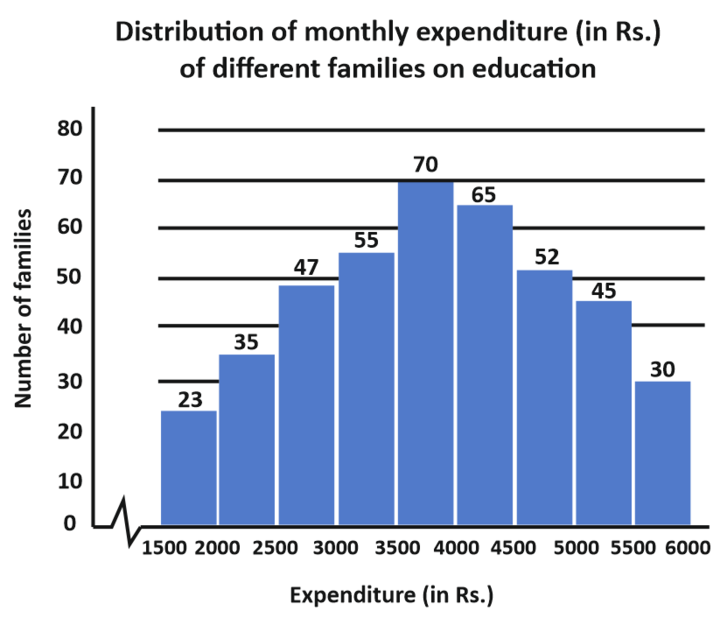
Study the graphs and answer the question.
What is the ratio of families whose monthly expenditures on education are below 3,000 to the number of families whose monthly expenditure on education are Rs.4,000 or above but less than Rs. 5,500?