Time Left - 10:00 mins
Wrong Number Series & Line Graph II Quantitative Aptitude II MH-CET 2021 II 24 August
Attempt now to get your rank among 604 students!
Question 1
Direction: In the given series one number is wrong, find the wrong number.
8, 351, 135, 262, 196, 223, 215
Question 2
Direction: In the given series, one number doesn't fit the pattern. Find the wrong number that doesn't fit the pattern.
20, 24, 16, 26, 12, 32, 8
Question 3
Direction: In the given series one number is wrong, find out the wrong number.
81 , 41 , 23 , 11 , 6 , 3.5
Question 4
Direction: Find the wrong term in the given series:
16, 17, 26, 51, 100, 184, 302
Question 5
Direction: Find the wrong term in the given series:
33, 102, 412, 2020, 12396
Question 6
Direction: Study the given information carefully to answer the following questions.
The line graph depicts the number (in thousands) of Sanitizers produced by Companies X and Y from January to May.
The line graph depicts the number (in thousands) of Sanitizers produced by Companies X and Y from January to May.
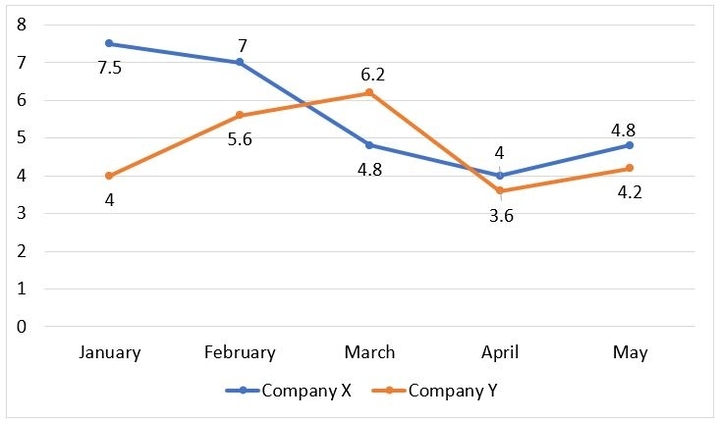
The difference between the number of sanitizers produced by company Y in January and March is what percent of the total number of sanitizers produced by both the companies X and Y during the month of May?
Question 7
Direction: Study the given information carefully to answer the following questions.
The line graph depicts the number (in thousands) of Sanitizers produced by Companies X and Y from January to May.
The line graph depicts the number (in thousands) of Sanitizers produced by Companies X and Y from January to May.
Find the ratio between the number of sanitizers produced by Company X in March and April together to the total number of sanitizers produced by Company Y in January and May together.
Question 8
Direction: Study the given information carefully to answer the following questions.
The line graph depicts the number (in thousands) of Sanitizers produced by Companies X and Y from January to May.
The line graph depicts the number (in thousands) of Sanitizers produced by Companies X and Y from January to May.
If in March, Company X and Y produced 15% and 25% of their sanitizers respectively as defective, then find the average of number of sanitizers that are produced non-defective by both the companies in the same month.
Question 9
Direction: Study the given information carefully to answer the following questions.
The line graph depicts the number (in thousands) of Sanitizers produced by Companies X and Y from January to May.
The line graph depicts the number (in thousands) of Sanitizers produced by Companies X and Y from January to May.
In the month May, both the companies are able to sold 85% of their sanitizers. In the month June, sanitizers sold by both the companies increased by 10% each than the previous month. Find the total number of sanitizers sold by both the Companies in June.
Question 10
Direction: Study the given information carefully to answer the following questions.
The line graph depicts the number (in thousands) of Sanitizers produced by Companies X and Y from January to May.
The line graph depicts the number (in thousands) of Sanitizers produced by Companies X and Y from January to May.
Find the average number of sanitizers manufactured by Company X in all the above-mentioned months.
- 604 attempts
- 5 upvotes
- 0 comments
Jun 30CAT & MBA

