SCATTER CHART || Data Interpretation || CAT 2021 || 27 September
Attempt now to get your rank among 195 students!
Question 1
Direction: To compare the rainfall data, India Meteorological Department (IMD) calculated the Long Period Average (LPA) of rainfall during period June-August for each of the 16 states. The figure given below shows the actual rainfall (measured in mm) during June-August, 2019 and the percentage deviations from LPA of respective states in 2018 . Each state along with its actual rainfall is presented in the figure.

Question 2
Direction: To compare the rainfall data, India Meteorological Department (IMD) calculated the Long Period Average (LPA) of rainfall during period June-August for each of the 16 states. The figure given below shows the actual rainfall (measured in mm) during June-August, 2019 and the percentage deviations from LPA of respective states in 2018 . Each state along with its actual rainfall is presented in the figure.
Question 3
Direction: To compare the rainfall data, India Meteorological Department (IMD) calculated the Long Period Average (LPA) of rainfall during period June-August for each of the 16 states. The figure given below shows the actual rainfall (measured in mm) during June-August, 2019 and the percentage deviations from LPA of respective states in 2018 . Each state along with its actual rainfall is presented in the figure.
Question 4
Direction: To compare the rainfall data, India Meteorological Department (IMD) calculated the Long Period Average (LPA) of rainfall during period June-August for each of the 16 states. The figure given below shows the actual rainfall (measured in mm) during June-August, 2019 and the percentage deviations from LPA of respective states in 2018 . Each state along with its actual rainfall is presented in the figure.
Question 5
Each point in the graph below shows the profit and turnover data for a company. Each company belongs to one of the three industries: textile, cement and steel.

Question 6
Each point in the graph below shows the profit and turnover data for a company. Each company belongs to one of the three industries: textile, cement and steel.
Question 7
Each point in the graph below shows the profit and turnover data for a company. Each company belongs to one of the three industries: textile, cement and steel.
Question 8
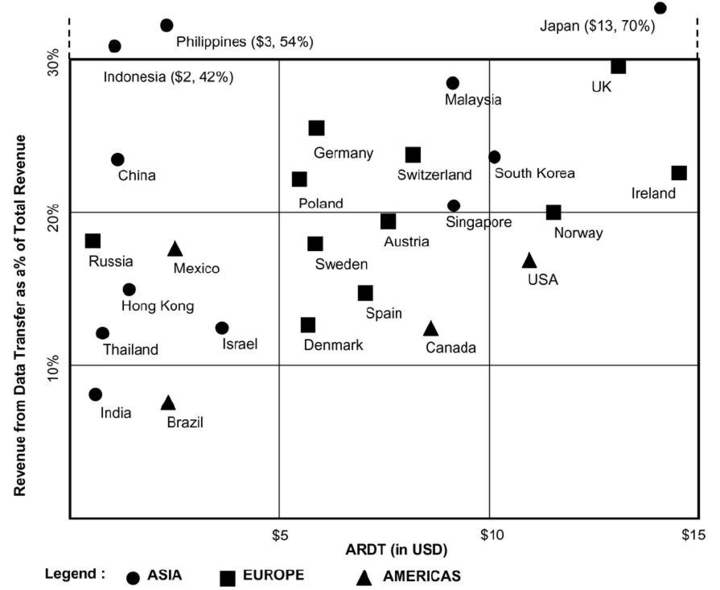
Telecom operators get revenue from transfer of data and voice. Average revenue received from transfer of each unit of data is known as ARDT. In the diagram below, the revenue received from data transfer as percentage of total revenue received and the ARDT in US Dollars (USD) are given for various countries.
Question 9
Telecom operators get revenue from transfer of data and voice. Average revenue received from transfer of each unit of data is known as ARDT. In the diagram below, the revenue received from data transfer as percentage of total revenue received and the ARDT in US Dollars (USD) are given for various countries.
Question 10
Telecom operators get revenue from transfer of data and voice. Average revenue received from transfer of each unit of data is known as ARDT. In the diagram below, the revenue received from data transfer as percentage of total revenue received and the ARDT in US Dollars (USD) are given for various countries.
- 195 attempts
- 5 upvotes
- 1 comment

