Time Left - 12:00 mins
Attempt now to get your rank among 3039 students!
Question 1
The curved surface area of a hemisphere is twice of the base area of a cone. The slant height and base area of the cone are 10 cm and 36π cm2. What is the ratio of the volume of the hemisphere and the cone?
Question 2
What are the number of diagonals in a decagon?
Question 3
Sanjay adds ‘x’ litres water to pure milk to make a 52-litre milk-water solution. He sells this solution at a price that is 10% more than the cost price of pure milk and makes a profit of 43% on this transaction. If he adds ‘x’ litres water to 60 litres pure milk and sells the resulting solution at the cost price of pure milk, then what is the profit percentage in this transaction? (Note: Assume water is free of cost)
Question 4
Sumit and Soumen started a partnership business by investing Rs. 4800 and Rs. 5200 respectively. After 4 months, Sumit invested Rs. 200 more and Soumen invested Rs. 600 more. Find the total profit after one year if the share of Soumen was Rs. 21000.
Question 5
A, B and C alone can finish a certain work in 15, 20 and 30 days respectively. They start working together and after some days C left the work. At the completion of work, they were paid total of Rs. 27000, and B received an amount 9000 more than C. Find the number of days for which B worked.
Question 6
Direction: Study the following line graphs carefully and answer the questions given below.
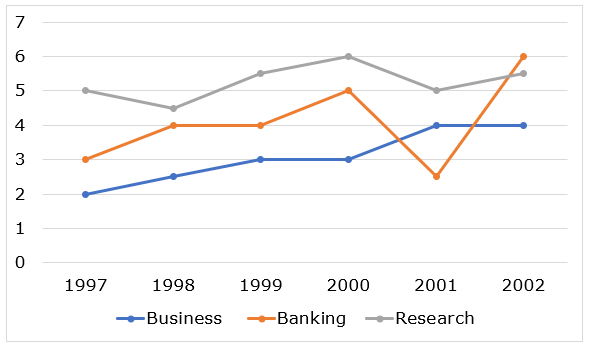
The given below line graph shows the percentage expenditure (of GDP) on Business, Banking & Research.
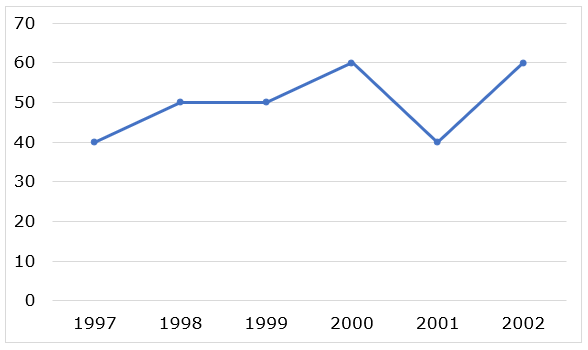
The given below line graph shows the GDP from 1997-2002 (in crores rupees).
The given below line graph shows the percentage expenditure (of GDP) on Business, Banking & Research.
In 2000, what is the ratio of amount spent on Business to Banking to Research?
Question 7
Direction: Study the following line graphs carefully and answer the questions given below.
The given below line graph shows the percentage expenditure (of GDP) on Business, Banking & Research.
The given below line graph shows the GDP from 1997-2002 (in crores rupees).
The given below line graph shows the percentage expenditure (of GDP) on Business, Banking & Research.
The GDP growth from 1997 to 1998 is what per cent of the GDP growth from 2001 to 2002?
Question 8
Direction: Study the following line graphs carefully and answer the questions given below.
The given below line graph shows the percentage expenditure (of GDP) on Business, Banking & Research.
The given below line graph shows the GDP from 1997-2002 (in crores rupees).
The given below line graph shows the percentage expenditure (of GDP) on Business, Banking & Research.
What is the total amount (in crore) allotted to Research during 1997-2002?
Question 9
Direction: Study the following line graphs carefully and answer the questions given below.
The given below line graph shows the percentage expenditure (of GDP) on Business, Banking & Research.
The given below line graph shows the GDP from 1997-2002 (in crores rupees).
The given below line graph shows the percentage expenditure (of GDP) on Business, Banking & Research.
In which of the following years is the total amount allotted to Business, Banking and Research the maximum?
Question 10
Direction: Study the following line graphs carefully and answer the questions given below.
The given below line graph shows the percentage expenditure (of GDP) on Business, Banking & Research.
The given below line graph shows the GDP from 1997-2002 (in crores rupees).
The given below line graph shows the percentage expenditure (of GDP) on Business, Banking & Research.
What is the difference between the amount allotted to Business in 1999 and that in 2000?
- 3039 attempts
- 8 upvotes
- 36 comments
Nov 29PO, Clerk, SO, Insurance

