RADAR CHART || Data Interpretation || CAT 2021 || 29 September
Attempt now to get your rank among 176 students!
Question 1
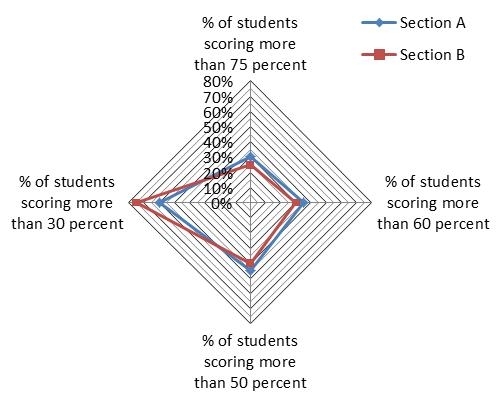
The chart shows the % of students in two sections A & B scoring in certain range of percentages with respect to the total marks in Physical sciences in an exam.
Note: 1) Total students in Class A = 300
& Total students in Class B = 400
2) Scoring not more than 30% marks is considered ‘FAIL’.
Find the difference between the number of students who failed from section A & section B?
Question 2
The chart shows the % of students in two sections A & B scoring in certain range of percentages with respect to the total marks in Physical sciences in an exam.
Note: 1) Total students in Class A = 300
& Total students in Class B = 400
2) Scoring not more than 30% marks is considered ‘FAIL’.
Question 3
The chart shows the % of students in two sections A & B scoring in certain range of percentages with respect to the total marks in Physical sciences in an exam.
Note: 1) Total students in Class A = 300
& Total students in Class B = 400
2) Scoring not more than 30% marks is considered ‘FAIL’.
Question 4
The chart shows the % of students in two sections A & B scoring in certain range of percentages with respect to the total marks in Physical sciences in an exam.
Note: 1) Total students in Class A = 300
& Total students in Class B = 400
2) Scoring not more than 30% marks is considered ‘FAIL’.
Question 5
The chart shows the % of students in two sections A & B scoring in certain range of percentages with respect to the total marks in Physical sciences in an exam.
Note: 1) Total students in Class A = 300
& Total students in Class B = 400
2) Scoring not more than 30% marks is considered ‘FAIL’.
Question 6
The radar chart shows 4 industries of India and taxes levied on them.

Question 7
The radar chart shows 4 industries of India and taxes levied on them.

Question 8
The radar chart shows 4 industries of India and taxes levied on them.

Question 9
The radar chart shows 4 industries of India and taxes levied on them.

Question 10
The radar chart shows 4 industries of India and taxes levied on them.

- 176 attempts
- 1 upvote
- 1 comment

