Time Left - 25:00 mins
RADAR CHART ADVANCED || Data Interpretation || CAT 2021 || 1 October
Attempt now to get your rank among 195 students!
Question 1
Directions∶Study the data given below and answer the following questions. The radar graph shown below shows the number of days to be taken by different workers A, B, C and D to complete a particular task individually and amount of wages to be earned by them per day when they work.


If A, B, C and D work for alternate days i.e. A for 1st day, B for 2nd day, C for 3rdday and D for 4th day. In how many days the task will get complete?
Question 2
Directions∶Study the data given below and answer the following questions. The radar graph shown below shows the number of days to be taken by different workers A, B, C and D to complete a particular task individually and amount of wages to be earned by them per day when they work.
B and C do the work together for 2 days. Then, C left but D joined and B and D continue the work for 2 more days. Then, B left and D alone continue the work for more 2 days. Then, D left and remaining work is completed by C alone. Calculate the amount to be received by C.
Question 3
Directions∶Study the data given below and answer the following questions. The radar graph shown below shows the number of days to be taken by different workers A, B, C and D to complete a particular task individually and amount of wages to be earned by them per day when they work.
Which worker is the most expensive?
Question 4
Directions∶Study the data given below and answer the following questions. The radar graph shown below shows the number of days to be taken by different workers A, B, C and D to complete a particular task individually and amount of wages to be earned by them per day when they work.
A and B take time in the ratio of 1 : 2 to complete the half the work. What part of the total work is done by each individually?
Question 5
Directions∶Study the data given below and answer the following questions. The radar graph shown below shows the number of days to be taken by different workers A, B, C and D to complete a particular task individually and amount of wages to be earned by them per day when they work.
D receives Rs. 165 for the work done by him. Work done by C is 2/3 of the work done by B, Work done by B is 1/3 of the work done by D and remaining work is done by A to finish it. Calculate the wages received by A and the ratio of wages of B and C.
Question 6
Directions: The following radar gives the average of five bowlers for the two years i.e. 2011 and 2012 in the domestic cricket matches. In cricket, the average of a bowler is the ratio of runs conceded by him to the total number of wickets taken by him
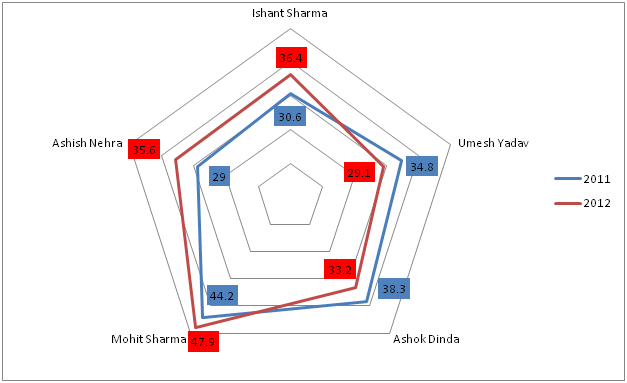
Which of the following players had the least percentage change in his average from 2011 to 2012?
Question 7
Directions: The following radar gives the average of five bowlers for the two years i.e. 2011 and 2012 in the domestic cricket matches. In cricket, the average of a bowler is the ratio of runs conceded by him to the total number of wickets taken by him
The number of wickets taken by Ishant Sharma in 2012 was 20% less than that by him in 2011, while the number of wickets taken by Umesh Yadav in 2012 was 15% more than that by him in 2011. Also, the number of wickets taken by Ashok Dinda in 2012 was 10% more than that by him in 2011, while the number of wickets taken by Ashish Nehra in 2012 was 20% less than that by him in 2011. Which of the following statements is definitely true?
1) The runs conceded by Ishant Sharma in 2012 were more than that in 2011
2) The runs conceded by Umesh Yadav in 2011 were more than that in 2012
3) The runs conceded by Ashok Dinda in 2011 were more than that in 2012
4) The runs conceded by Ashish Nehra in 2012 were more than that in 2011
5) The runs conceded by Umesh Yadav in 2012 were more than that in 2011
Question 8
Directions: The following radar gives the average of five bowlers for the two years i.e. 2011 and 2012 in the domestic cricket matches. In cricket, the average of a bowler is the ratio of runs conceded by him to the total number of wickets taken by him
In 2011, the number of runs conceded by Mohit Sharma was 50% more than the number of runs conceded by Umesh Yadav in the same year. It can be concluded in 2011 that
Question 9
Directions: The following radar gives the average of five bowlers for the two years i.e. 2011 and 2012 in the domestic cricket matches. In cricket, the average of a bowler is the ratio of runs conceded by him to the total number of wickets taken by him
If every bowler in 2012 conceded runs as given in the table below, what was the average number of wickets taken by the 5 bowlers in 2012?

Question 10
Directions: The following radar gives the average of five bowlers for the two years i.e. 2011 and 2012 in the domestic cricket matches. In cricket, the average of a bowler is the ratio of runs conceded by him to the total number of wickets taken by him
If in the year 2013, the average of Mohit Sharma is 10% more than the average of Umesh Yadav in the same year and it is also known that the average of Umesh Yadav is reduced by 10% in 2013 as compared to year, 2011, then what is the percentage decrease in average of Mohit Sharma in 2013 as compared to 2011? The average of Umesh Yadav in 2011 was interchanged by mistake with his average in 2012.
- 195 attempts
- 2 upvotes
- 0 comments
Oct 1CAT & MBA

