Time Left - 10:00 mins
Attempt now to get your rank among 2303 students!
Question 1
Direction: Study the following pie-charts to answer the following questions.
Students from 7 different schools – A, B, C, D, E, F and G were selected to give a competitive exam out of which some students passed the exam as given.
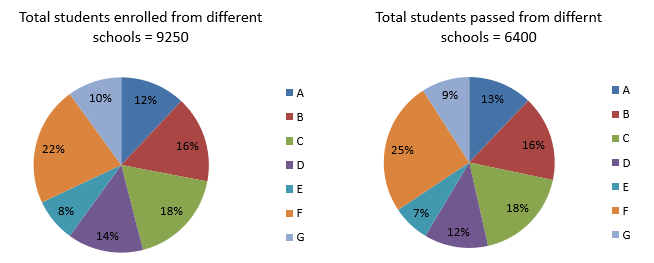
Students from 7 different schools – A, B, C, D, E, F and G were selected to give a competitive exam out of which some students passed the exam as given.
What percentage of students passed the exam from school E out of a total number of students enrolled from the same school?
Question 2
Direction: Study the following pie-charts to answer the following questions.
Students from 7 different schools – A, B, C, D, E, F and G were selected to give a competitive exam out of which some students passed the exam as given.
Students from 7 different schools – A, B, C, D, E, F and G were selected to give a competitive exam out of which some students passed the exam as given.
Which schools has the highest percentage of students passed to students enrolled?
Question 3
Direction: Study the following pie-charts to answer the following questions.
Students from 7 different schools – A, B, C, D, E, F and G were selected to give a competitive exam out of which some students passed the exam as given.
Students from 7 different schools – A, B, C, D, E, F and G were selected to give a competitive exam out of which some students passed the exam as given.
The number of students passed from schools A and D together is approximately what percent less than the number of students enrolled from schools C and E together?
Question 4
Direction: Study the following pie-charts to answer the following questions.
Students from 7 different schools – A, B, C, D, E, F and G were selected to give a competitive exam out of which some students passed the exam as given.
Students from 7 different schools – A, B, C, D, E, F and G were selected to give a competitive exam out of which some students passed the exam as given.
What is the approximate percentage of students passed from the students enrolled for school B and C together?
Question 5
Direction: Study the following pie-charts to answer the following questions.
Students from 7 different schools – A, B, C, D, E, F and G were selected to give a competitive exam out of which some students passed the exam as given.
Students from 7 different schools – A, B, C, D, E, F and G were selected to give a competitive exam out of which some students passed the exam as given.
What is the difference of the number of students enrolled from schools D and G together and the number of students passed from schools E and F together?
Question 6
Direction: Study the table given below and answer the following questions. The table shows the data of 5 schools for the year 2017.

If the given difference in the bracket (), it means number of girls is more than number of boys and if the given difference is without the bracket it means number of boys is more than number of girls.
If the given difference in the bracket (), it means number of girls is more than number of boys and if the given difference is without the bracket it means number of boys is more than number of girls.
What is the ratio of the number of boys in school A to the number of girls in school D?
Question 7
Direction: Study the table given below and answer the following questions. The table shows the data of 5 schools for the year 2017.
If the given difference in the bracket (), it means number of girls is more than number of boys and if the given difference is without the bracket it means number of boys is more than number of girls.
If the given difference in the bracket (), it means number of girls is more than number of boys and if the given difference is without the bracket it means number of boys is more than number of girls.
If in the year 2018, the number of students from school D increased by 30% as compared to 2017 and this increase was divided among boys and girls in the ratio of 10: 3, then find the number of girls in school D in 2018.
Question 8
Direction: Study the table given below and answer the following questions. The table shows the data of 5 schools for the year 2017.
If the given difference in the bracket (), it means number of girls is more than number of boys and if the given difference is without the bracket it means number of boys is more than number of girls.
If the given difference in the bracket (), it means number of girls is more than number of boys and if the given difference is without the bracket it means number of boys is more than number of girls.
The number of girls in school D and E together are how much percent more than the number of boys in school B?
Question 9
Direction: Study the table given below and answer the following questions. The table shows the data of 5 schools for the year 2017.
If the given difference in the bracket (), it means number of girls is more than number of boys and if the given difference is without the bracket it means number of boys is more than number of girls.
If the given difference in the bracket (), it means number of girls is more than number of boys and if the given difference is without the bracket it means number of boys is more than number of girls.
If in the year 2017, only 1/3rd of the total number of girls passed from school C and the ratio of number of girls passed from school C to that of B are in the ratio of 1: 2, then how many girls failed from school B in the year 2017?
Question 10
Direction: Study the table given below and answer the following questions. The table shows the data of 5 schools for the year 2017.
If the given difference in the bracket (), it means number of girls is more than number of boys and if the given difference is without the bracket it means number of boys is more than number of girls.
If the given difference in the bracket (), it means number of girls is more than number of boys and if the given difference is without the bracket it means number of boys is more than number of girls.
What is the ratio of number of girls in school E to that of number of girls in school B?
- 2303 attempts
- 3 upvotes
- 2 comments
Oct 5PO, Clerk, SO, Insurance

