Attempt now to get your rank among 815 students!
Question 1
In the following line diagram, the number of pen and notebooks (in thousand) sold by 6 different stores in a certain year has been given.
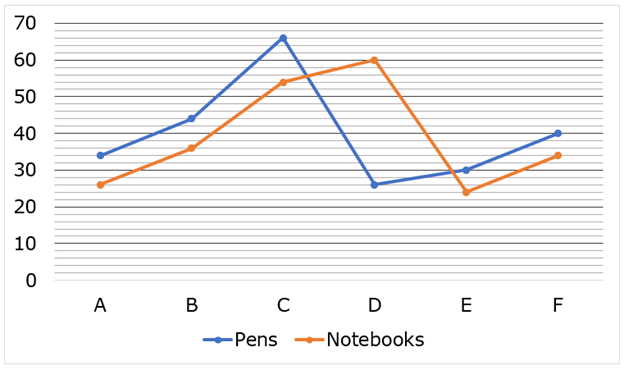
What is the average number of pens sold by all stores taken together in the given year?
Question 2
In the following line diagram, the number of pen and notebooks (in thousand) sold by 6 different stores in a certain year has been given.
Question 3
In the following line diagram, the number of pen and notebooks (in thousand) sold by 6 different stores in a certain year has been given.
Question 4
In the following line diagram, the number of pen and notebooks (in thousand) sold by 6 different stores in a certain year has been given.
Question 5
In the following line diagram, the number of pen and notebooks (in thousand) sold by 6 different stores in a certain year has been given.
- 815 attempts
- 1 upvote
- 9 comments

