Time Left - 06:00 mins
Attempt now to get your rank among 788 students!
Question 1
Direction: Study the following graph and table carefully and answer the given question.
The given below pie chart shows the percentage distribution of laptop sold in five months.
Total number of Laptop sold =60,000
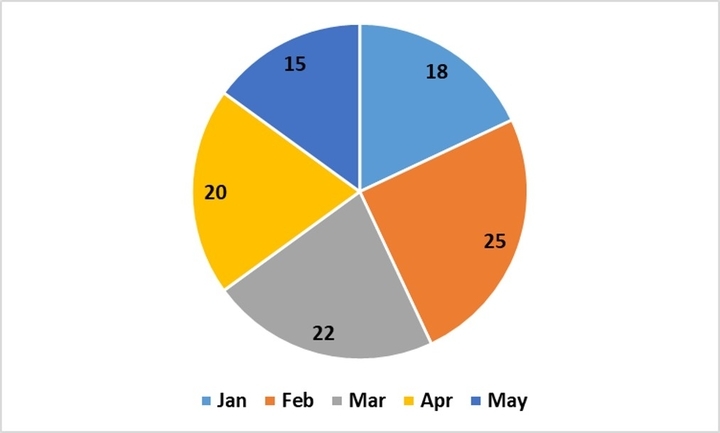
The ratio between the numbers of laptop sold of company X and company Y during five months.

The given below pie chart shows the percentage distribution of laptop sold in five months.
Total number of Laptop sold =60,000
The ratio between the numbers of laptop sold of company X and company Y during five months.
What is the ratio of the number of laptop sold of company Y during Jan to those sold during may of the same company?
Question 2
Direction: Study the following graph and table carefully and answer the given question.
The given below pie chart shows the percentage distribution of laptop sold in five months.
Total number of Laptop sold =60,000
The ratio between the numbers of laptop sold of company X and company Y during five months.
The given below pie chart shows the percentage distribution of laptop sold in five months.
Total number of Laptop sold =60,000
The ratio between the numbers of laptop sold of company X and company Y during five months.
If 45% of the laptops sold by company X during march were sold at a discount, how many laptops of company X during that month were sold without a discount?
Question 3
Direction: Study the following graph and table carefully and answer the given question.
The given below pie chart shows the percentage distribution of laptop sold in five months.
Total number of Laptop sold =60,000
The ratio between the numbers of laptop sold of company X and company Y during five months.
The given below pie chart shows the percentage distribution of laptop sold in five months.
Total number of Laptop sold =60,000
The ratio between the numbers of laptop sold of company X and company Y during five months.
If the company Y earns a profit of Rs 950 in selling each laptop during April, what was their total profit earned on the laptop selling of that company during the same month?
Question 4
Direction: Study the following graph and table carefully and answer the given question.
The given below pie chart shows the percentage distribution of laptop sold in five months.
Total number of Laptop sold =60,000
The ratio between the numbers of laptop sold of company X and company Y during five months.
The given below pie chart shows the percentage distribution of laptop sold in five months.
Total number of Laptop sold =60,000
The ratio between the numbers of laptop sold of company X and company Y during five months.
The number of laptop sold by company X during May is approximately what % of the number of laptops sold by company x during February?
Question 5
Direction: Study the following graph and table carefully and answer the given question.
The given below pie chart shows the percentage distribution of laptop sold in five months.
Total number of Laptop sold =60,000
The ratio between the numbers of laptop sold of company X and company Y during five months.
The given below pie chart shows the percentage distribution of laptop sold in five months.
Total number of Laptop sold =60,000
The ratio between the numbers of laptop sold of company X and company Y during five months.
What is the total number of laptops sold by company X during Feb, April and May together?
- 788 attempts
- 0 upvotes
- 4 comments
May 30PO, Clerk, SO, Insurance

