MEGA QUIZ 27 & WEEKLY REVISION || Logical Reasoning and Data Interpretation || CAT 2021 || 19 September
Attempt now to get your rank among 284 students!
Question 1
Direction: Study the following line graphs carefully to answer the given questions.
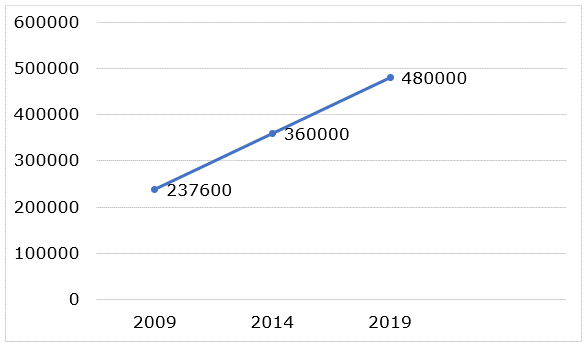
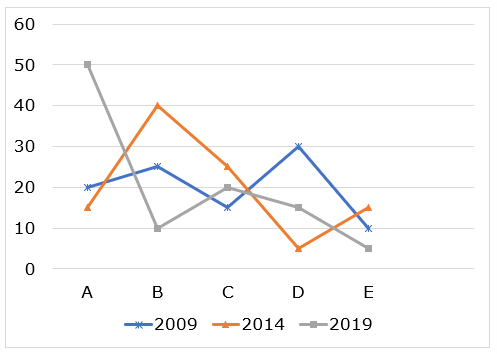
The first line graph represents the total number of voters who cast their votes in three different elections i.e., in year 2009, 2014 and 2019. The second line graph represents the percentage of the number of votes received by five candidates A, B, C, D and E in the given elections.


What was the difference between the number of votes received by the winning candidate in the elections of year 2009 and that by the winning candidate in the elections of year 2019?
Question 2
Direction: Study the following line graphs carefully to answer the given questions.
The first line graph represents the total number of voters who cast their votes in three different elections i.e., in year 2009, 2014 and 2019. The second line graph represents the percentage of the number of votes received by five candidates A, B, C, D and E in the given elections.


Question 3
A certain number of persons is sitting around a circular table, which has a circumference of 525 cm. All the persons are facing towards the center. They are sitting at distances to each other which are consecutive multiples of five in the anti-clockwise direction.
The table has a circumference of 525 cm. Two people sit between O and F. L and K are the immediate neighbors of B . The distance between S and W is the LCM of 7 cm and 15 cm. P sits to the left of T at a distance of 35 cm. M sits 4th to the right of L. S sits 4th to the right of A . J sits 2nd to the left of D. L sits 2nd to the right of T. The number of persons sitting between K and T is the same as between K and Q. Three people sit between A and D . O is an immediate neighbor of J.
Question 4
A certain number of persons is sitting around a circular table, which has a circumference of 525 cm. All the persons are facing towards the center. They are sitting at distances to each other which are consecutive multiples of five in the anti-clockwise direction.
The table has a circumference of 525 cm. Two people sit between O and F. L and K are the immediate neighbors of B . The distance between S and W is the LCM of 7 cm and 15 cm. P sits to the left of T at a distance of 35 cm. M sits 4th to the right of L. S sits 4th to the right of A . J sits 2nd to the left of D. L sits 2nd to the right of T. The number of persons sitting between K and T is the same as between K and Q. Three people sit between A and D . O is an immediate neighbor of J.
Question 5
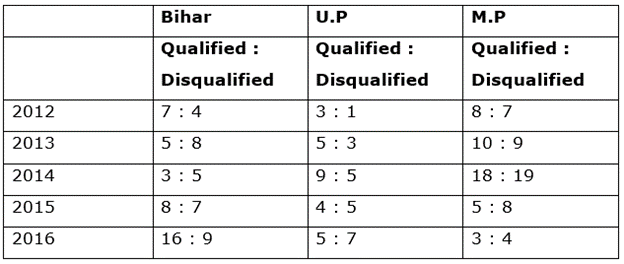
Number of candidates appeared for IBPS PO exam from three states Bihar, U.P and M.P. And ratio of qualified and disqualified are given below:

For Bihar ratio of males to females candidates qualified in 2014 is 8 : 5. If the total number of males candidates appeared from Bihar is 828. Then find the number of females candidates who are disqualified in 2014 from Bihar ?
Question 6
Number of candidates appeared for IBPS PO exam from three states Bihar, U.P and M.P. And ratio of qualified and disqualified are given below:

Question 7
Direction:Refer to the diagram below and answer the questions that follow:
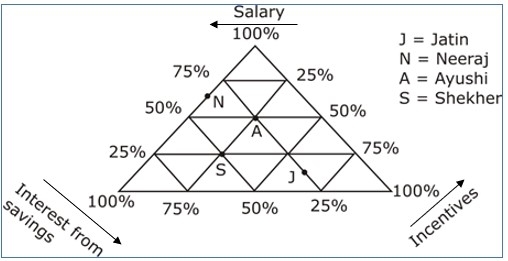
The triangular diagram given below shows the percentage distribution of income (Salary + Interest from savings + Incentives) in a month for four people(Jatin, Neeraj, Ayushi, Shekhar)
Interpretation: For a parameter of income, percentage is taken by first moving along that axis from the vertex marked as 100% and stopping at the point where the person's percentage diagonally in that parameter last crosses that axis(from 100%).
For example: For Ayushi, after stretching to incentive axis, it is 25%.

Question 8
Direction:Refer to the diagram below and answer the questions that follow:
The triangular diagram given below shows the percentage distribution of income (Salary + Interest from savings + Incentives) in a month for four people(Jatin, Neeraj, Ayushi, Shekhar)
Interpretation: For a parameter of income, percentage is taken by first moving along that axis from the vertex marked as 100% and stopping at the point where the person's percentage diagonally in that parameter last crosses that axis(from 100%).
For example: For Ayushi, after stretching to incentive axis, it is 25%.

Question 9
Ten people i.e., K, G, O, P, Z, D, B, L, Q, and U are sitting around a rectangular table. One person sits at each of the corners and the shorter sides of the table and two persons sit at the two larger sides of the table. The persons who are sitting at the corners are facing outside the center and the rest are facing inside. All this information is not necessarily in the same order.
Q, who is sitting at the corner of the table, is sitting just right of Z who is not sitting on the shorter side of the table. K is neither a neighbor of Q nor Z. D is sitting fourth to the left of Q and U is sitting just right of D. L is sitting second to the right of D. P is a neighbor of G. B is sitting second to the left of U. Only one person is sitting between Q and G.
Question 10
Ten people i.e., K, G, O, P, Z, D, B, L, Q, and U are sitting around a rectangular table. One person sits at each of the corners and the shorter sides of the table and two persons sit at the two larger sides of the table. The persons who are sitting at the corners are facing outside the center and the rest are facing inside. All this information is not necessarily in the same order.
Q, who is sitting at the corner of the table, is sitting just right of Z who is not sitting on the shorter side of the table. K is neither a neighbor of Q nor Z. D is sitting fourth to the left of Q and U is sitting just right of D. L is sitting second to the right of D. P is a neighbor of G. B is sitting second to the left of U. Only one person is sitting between Q and G.
- 284 attempts
- 1 upvote
- 0 comments

