Time Left - 15:00 mins
Attempt now to get your rank among 471 students!
Question 1
These are based on the tabulated data given below:
A company has 20 employees with their age (in years) and salary (in thousand rupees per month) mentioned against each of them:
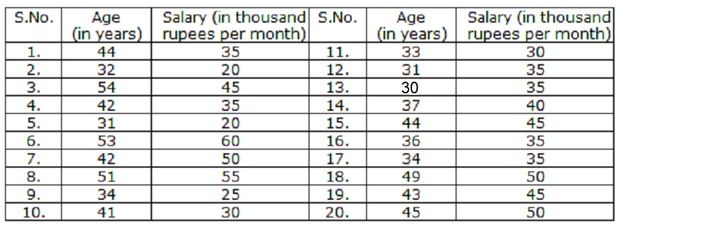
A company has 20 employees with their age (in years) and salary (in thousand rupees per month) mentioned against each of them:
Classify the data of age of each employee in class interval of 5 years. Which class interval of 5 years has the maximum average salary?
Question 2
These are based on the tabulated data given below:
A company has 20 employees with their age (in years) and salary (in thousand rupees per month) mentioned against each of them:
A company has 20 employees with their age (in years) and salary (in thousand rupees per month) mentioned against each of them:
What is the frequency (%) in the class interval of 30 – 35 years?
Question 3
These are based on the tabulated data given below:
A company has 20 employees with their age (in years) and salary (in thousand rupees per month) mentioned against each of them:
A company has 20 employees with their age (in years) and salary (in thousand rupees per month) mentioned against each of them:
What is the average age of the employees?
Question 4
These are based on the tabulated data given below:
A company has 20 employees with their age (in years) and salary (in thousand rupees per month) mentioned against each of them:
A company has 20 employees with their age (in years) and salary (in thousand rupees per month) mentioned against each of them:
What is the fraction (%) of employees getting salary ≥ 40,000 per month?
Question 5
These are based on the tabulated data given below:
A company has 20 employees with their age (in years) and salary (in thousand rupees per month) mentioned against each of them:
A company has 20 employees with their age (in years) and salary (in thousand rupees per month) mentioned against each of them:
What is the average salary (in thousand per month) in the age group 40 – 50 years?
Question 6
Direction: Consider the following table that shows expenditures of a company (in lakh rupees) per annum over the given years. Answer the questions based on the data contained in the table:

What is the average amount of interest per year which the company had to pay (in Rupees) during this period?
Question 7
Direction: Consider the following table that shows expenditures of a company (in lakh rupees) per annum over the given years. Answer the questions based on the data contained in the table:
The total amount of bonus paid by the company during the given period is approximately what percent of the total amount of salary paid during this period?
Question 8
Direction: Consider the following table that shows expenditures of a company (in lakh rupees) per annum over the given years. Answer the questions based on the data contained in the table:
Total expenditure of all the items in 2008 was approximately what percent of the total expenditure in 2012?
Question 9
Direction: Consider the following table that shows expenditures of a company (in lakh rupees) per annum over the given years. Answer the questions based on the data contained in the table:
The approximate ratio between the total expenditure on taxes for all the years and the total expenditure on transport for all the years is
Question 10
Direction: Consider the following table that shows expenditures of a company (in lakh rupees) per annum over the given years. Answer the questions based on the data contained in the table:
The approximate ratio between the total expenditure of the company in the year 2008 and the total expenditure of the company in the year 2009 is
- 471 attempts
- 1 upvote
- 3 comments
Tags :
UGC NET & SETPaper IJun 6UGC NET & SET

