Time Left - 15:00 mins
Attempt now to get your rank among 310 students!
Question 1
These are based on the tabulated data given below:
A company has 20 employees with their age (in years) and salary (in thousand rupees per month) mentioned against each of them:
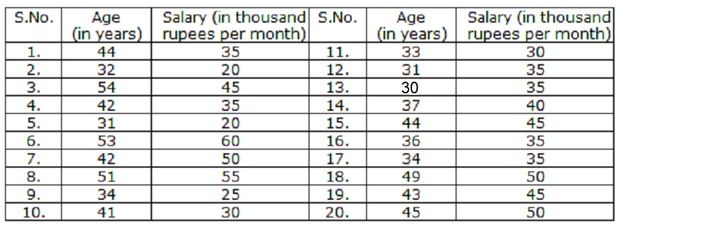
A company has 20 employees with their age (in years) and salary (in thousand rupees per month) mentioned against each of them:
Classify the data of age of each employee in class interval of 5 years. Which class interval of 5 years has the maximum average salary?
Question 2
These are based on the tabulated data given below:
A company has 20 employees with their age (in years) and salary (in thousand rupees per month) mentioned against each of them:
A company has 20 employees with their age (in years) and salary (in thousand rupees per month) mentioned against each of them:
What is the frequency (%) in the class interval of 30 – 35 years?
Question 3
These are based on the tabulated data given below:
A company has 20 employees with their age (in years) and salary (in thousand rupees per month) mentioned against each of them:
A company has 20 employees with their age (in years) and salary (in thousand rupees per month) mentioned against each of them:
What is the average age of the employees?
Question 4
These are based on the tabulated data given below:
A company has 20 employees with their age (in years) and salary (in thousand rupees per month) mentioned against each of them:
A company has 20 employees with their age (in years) and salary (in thousand rupees per month) mentioned against each of them:
What is the fraction (%) of employees getting salary ≥ 40,000 per month?
Question 5
These are based on the tabulated data given below:
A company has 20 employees with their age (in years) and salary (in thousand rupees per month) mentioned against each of them:
A company has 20 employees with their age (in years) and salary (in thousand rupees per month) mentioned against each of them:
What is the average salary (in thousand per month) in the age group 40 – 50 years?
Question 6
Direction: Consider the following table that shows the number (in lakhs) of different sizes of LED television sets sold by a company over the last seven years from 2012 to 2018. Answer the questions based on the data contained in the table.
Sale of LED Television sets (in lakhs) of different sizes (in inches)

What was the approximate percentage increase/decrease in the sales of 32-inch LED Television sets in 2017 compared to that in 2013?
Question 7
Direction: Consider the following table that shows the number (in lakhs) of different sizes of LED television sets sold by a company over the last seven years from 2012 to 2018. Answer the questions based on the data contained in the table.
Sale of LED Television sets (in lakhs) of different sizes (in inches)
For which size LET Television sets is the total sales of all the seven years the maximum?
Question 8
Direction: Consider the following table that shows the number (in lakhs) of different sizes of LED television sets sold by a company over the last seven years from 2012 to 2018. Answer the questions based on the data contained in the table.
Sale of LED Television sets (in lakhs) of different sizes (in inches)
What is the difference in the number of 40-inch Television sets sold in 2013 and 2018?
Question 9
Direction: Consider the following table that shows the number (in lakhs) of different sizes of LED television sets sold by a company over the last seven years from 2012 to 2018. Answer the questions based on the data contained in the table.
Sale of LED Television sets (in lakhs) of different sizes (in inches)
What is the total sale of Television sets of size 49-inches (in lakhs) over all the sevel years?
Question 10
Direction: Consider the following table that shows the number (in lakhs) of different sizes of LED television sets sold by a company over the last seven years from 2012 to 2018. Answer the questions based on the data contained in the table.
Sale of LED Television sets (in lakhs) of different sizes (in inches)
For which LET Television set is the total sales of all the seven years the minimum?
- 310 attempts
- 0 upvotes
- 6 comments
Tags :
UGC NET & SETPaper IJun 6UGC NET & SET

