Attempt now to get your rank among 210 students!
Question 1
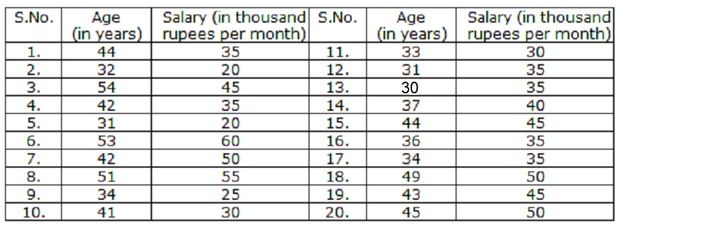
A company has 20 employees with their age (in years) and salary (in thousand rupees per month) mentioned against each of them:
Question 2
A company has 20 employees with their age (in years) and salary (in thousand rupees per month) mentioned against each of them:
Question 3
A company has 20 employees with their age (in years) and salary (in thousand rupees per month) mentioned against each of them:
Question 4
A company has 20 employees with their age (in years) and salary (in thousand rupees per month) mentioned against each of them:
Question 5
A company has 20 employees with their age (in years) and salary (in thousand rupees per month) mentioned against each of them:
Question 6
Consider the following table that shows percent profit earned by company ABC and company XYZ during the year 2011-2016.
Answer the questions based on the data contained in the table:

If the income of company ABC in 2013 and that in 2015 were equal and the amount invested in 2013 was Rs. 8,00,000 what was the amount invested in 2015?
Question 7
Consider the following table that shows percent profit earned by company ABC and company XYZ during the year 2011-2016.
Answer the questions based on the data contained in the table:
Question 8
Consider the following table that shows percent profit earned by company ABC and company XYZ during the year 2011-2016.
Answer the questions based on the data contained in the table:
Question 9
Consider the following table that shows percent profit earned by company ABC and company XYZ during the year 2011-2016.
Answer the questions based on the data contained in the table:
Question 10
Consider the following table that shows percent profit earned by company ABC and company XYZ during the year 2011-2016.
Answer the questions based on the data contained in the table:
- 210 attempts
- 0 upvotes
- 2 comments
Tags :
UGC NET & SETPaper I
