Study the following table and answer questions: Number of students studying in five schools of a city.
The ratio of the number of boys in school A to the number of girls in school E is:
Question 2
The line chart given below shows the production (in 10000s) of cars in 7 different months.
What is the average monthly production for the given 7 months?
Question 3
The table given below shows the marks obtained by 4 students in 5 subjects. The maximum marks of each subject is 100.
What are the average marks per subject obtained by P2?
Question 4
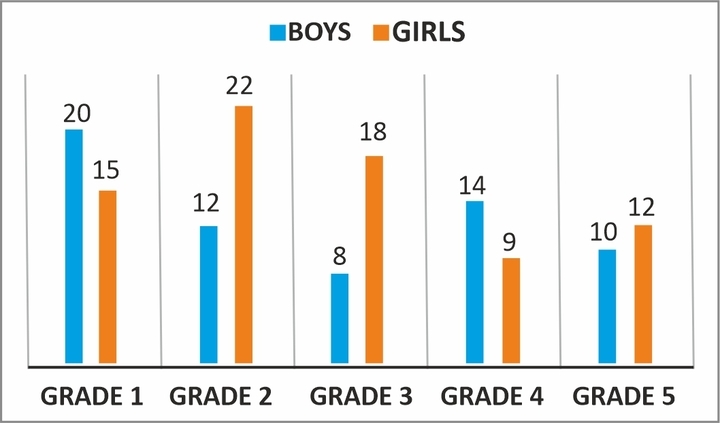
The first graph shows the number of students (boys and girls in thousands) in Grade 1 to Grade 5.
And the bar graph below shows the percentage share of five schools in the total
students studying in that class.
Based on the information, if the boys to girls ratio in school D is 3 : 1, then the number of boys studying in School D is:
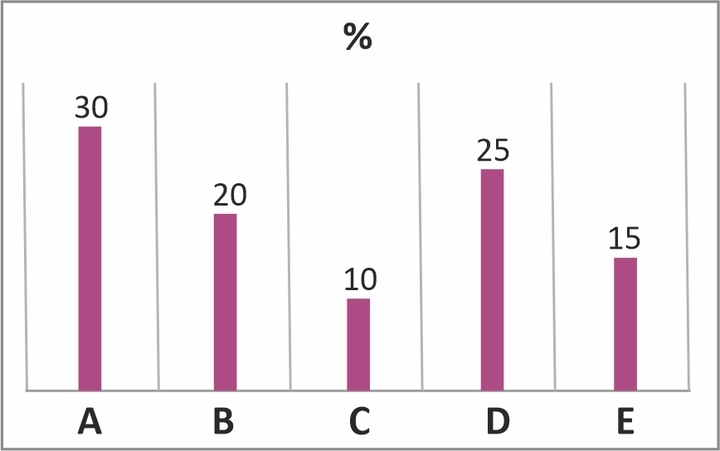
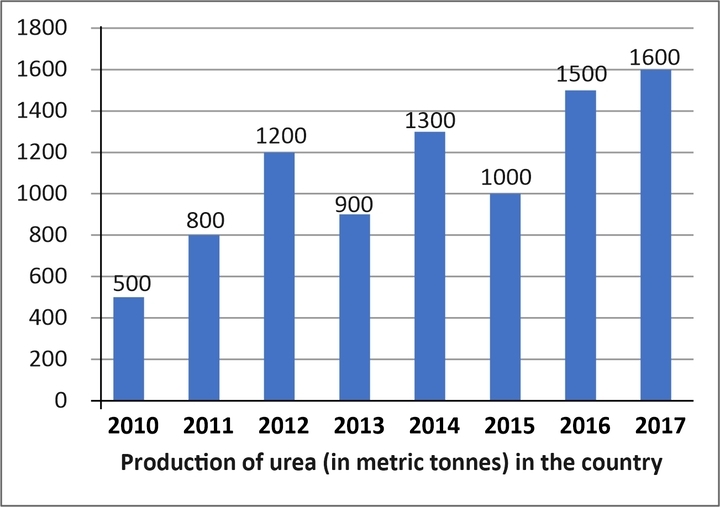
Question 5
Study the given chart carefully and answer the question accordingly.
In which of the following years was the percentage increase in production from the previous year, the maximum among the given years?
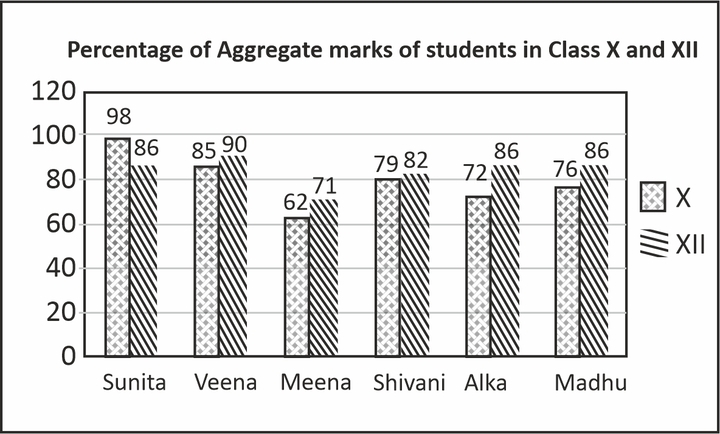
Question 6
The following graph shows the performance in aggregate marks of 2 board examinations of a group of friends. On the basis of the graph, identify the girl who has shown the maximum improvement from class X to class XII.
Question 7
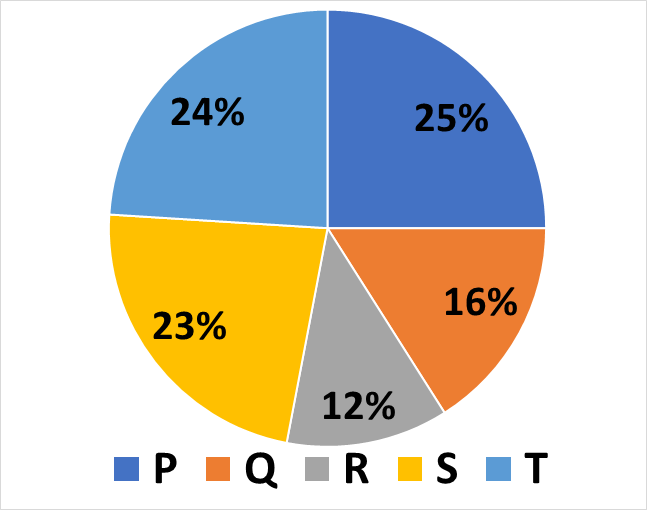
The pie-chart shows the percentage-wise distribution of the number of students in five different schools P, Q, R, S and T. The total number of students in all five schools together is 10,500.
Study the pie-chard and answer the question.
The number of students in school R is what per cent of the total number of students in schools Q and T together?
Question 8
Direction: The Bar Graph shows the Profit (rupees in Lakhs) earned by two companies P and Q during the period 2011 to 2017.
The ratio of average profit during the given period for Company P to Company Q is:
Question 9
The following table shows the items of expenditure of a company (in Rs. Lakh per annum), from 2015 to 2019.
What is the average amount of interest per year which the company has to pay during this period?
Question 10
The given table represents the revenue (in crores) of a company from the sale of four products A, B, C and D in 6 years. Study the table carefully and answer the question that follows.
The total revenue of company from the sale of products B, C and D in 2014 is what percentage of the revenue from the sale of products C and D in 6 years?