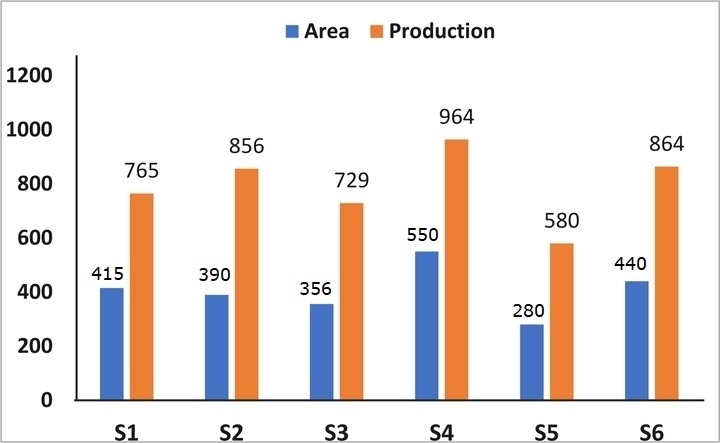
The following graph shows the production of paddy in the agricultural land available the 6 places S1, S2, S3, S4, S5, S6 (area in hundreds of hectares and production in thousands of tonnes)
Based on the information, the production ratio (production to land) is highest and lowest, respectively, in:
Question 2
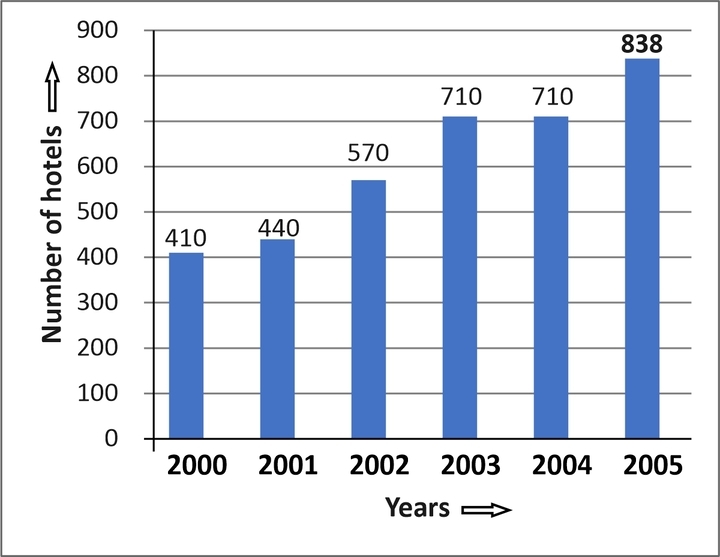
Study the given chart and answer the question.
In which of the given years is the percentage increase in the number of hotels in comparison to the previous year, is the maximum?
Question 3
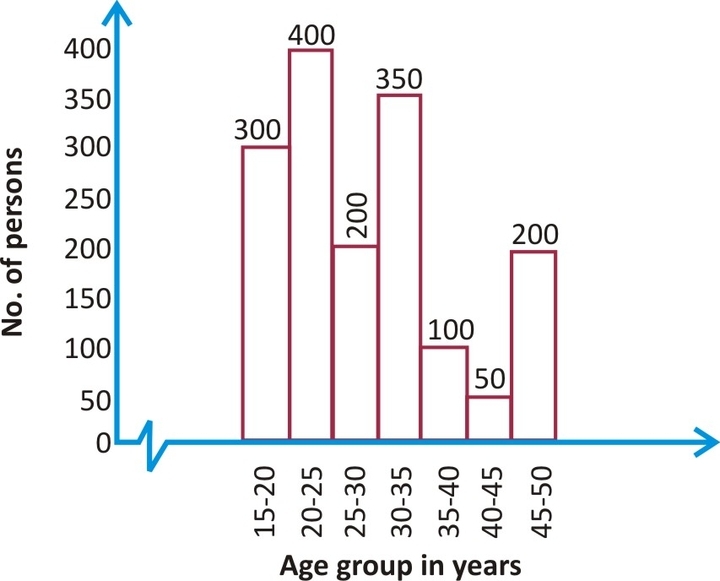
Direction: A study was made for the number of persons of different age group visited in a library in a week which is show in the histogram. Study the histogram and answer the question given below.
The ratio of the number of persons in the age groups 15-20 years and 20-25 years together, to the number of persons in the age groups 30-35 years and 35-40 years together, is:
Question 4
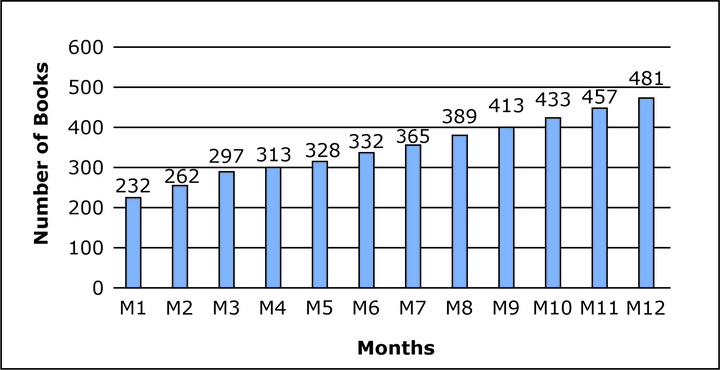
Direction: The Bar graph given below presents the number of books sold by a bookseller during different months of a year.
The number of books sold in month M8 is how much more than the average number of books sold per month?
Question 5
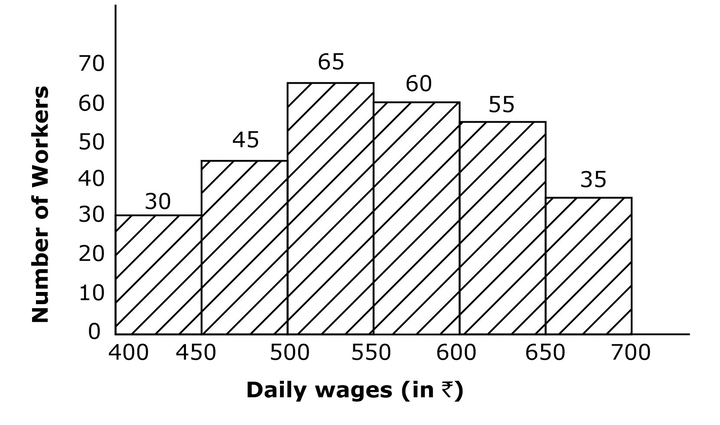
Study the given histogram and answer the question that follows.
What is the difference between the total number of workers whose daily wages are less than Rs.450 and the total number of workers whose daily wages are Rs.650 and above?
Question 6
Study the given histogram and answer the question that follows.
The number of persons weighing 55 kg or more but less than 75 kg is what percentage more than the number of persons weighing 80 kg or more but less than 100 kg (correct to one decimal place)?
Question 7
Direction: The pie chart given below shows sale of different types of cars in a city for a given year. The total sale of cars in the city is 600000.
How many T4 cars are sold in the city for the given year?
Question 8
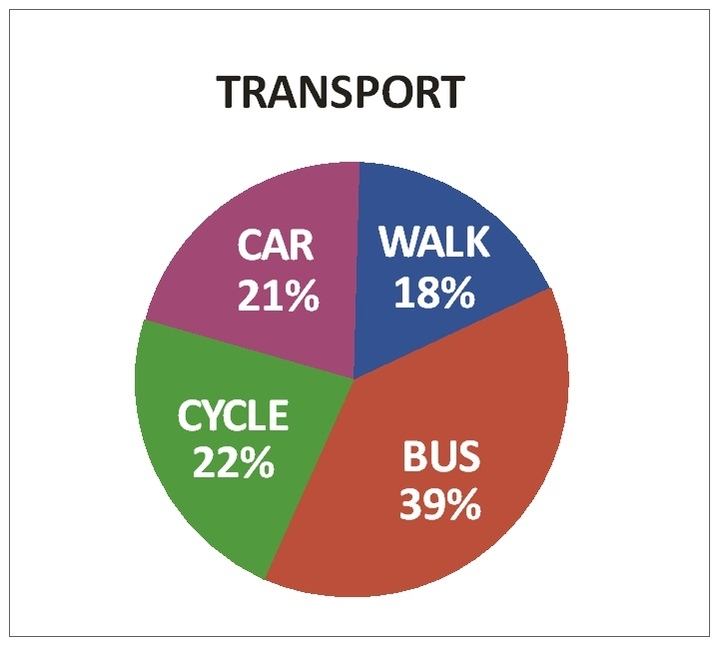
The given pie – chart depicts the percentage of students coming to school using different modes of transport. Total number of students = 1300
In the given pie-chart, the difference between the number of students travelling by bus or walk and the number of students travelling by car or cycle.
Question 9
Direction: Students from different countries (A, B, C, D, E, F) participated in a certain seminar. The pie chart shows how many students come from each of the six participating countries. Study the diagram and answer the following questions.
What is the angular measure (in degrees) of the sector representing Country A?
Question 10
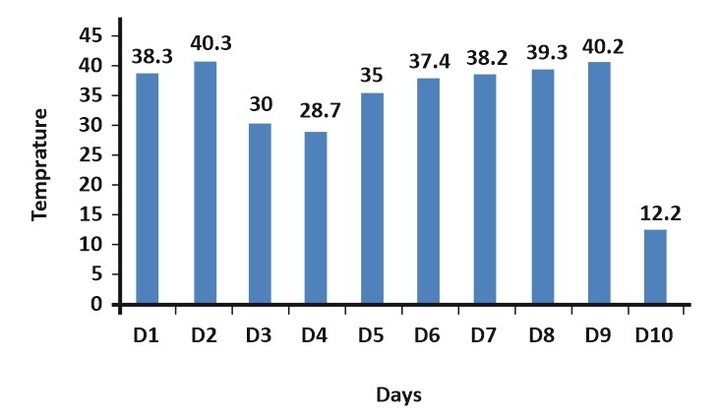
The Bar graph given below presents the maximum temperature (in oC) of a city for 10 different days spread over several months.
The temperature on D5 is how much percentage more than the temperature on D3?