Refer the below data table and answer the following Question. What percent students who chose Engineering are girls?
Question 2
Direction: Study the following information carefully and answer the question given below:
Subscription to different Schemes of Mutual Fund Company over the months in year 2008-2009. (Rupees in Crore)
If the Subscription to a Scheme is the criterion of popularity, which of the Schemes can be termed as most popular over the months?
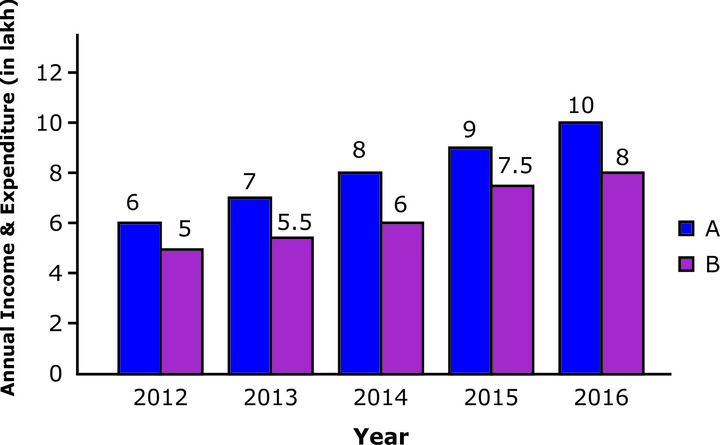
Question 3
The given Bar Graph presents the data of annual income (A) and annual expenditure (B) of an IT official in a multi-national company during the years 2012 to 2016.
What was his average monthly savings in 2015 and 2016, taken together (correct to two decimal places)?
Question 4
Refer the below data table and answer the following Question. What is the ratio of boys to girls?
Question 5
Refer the below data table and answer the following Question. If the company has issued six lakh shares between its five partners and if Chinmay offers to sell 15000 of his shares to Ejaz, then Ejaz will have how many shares?
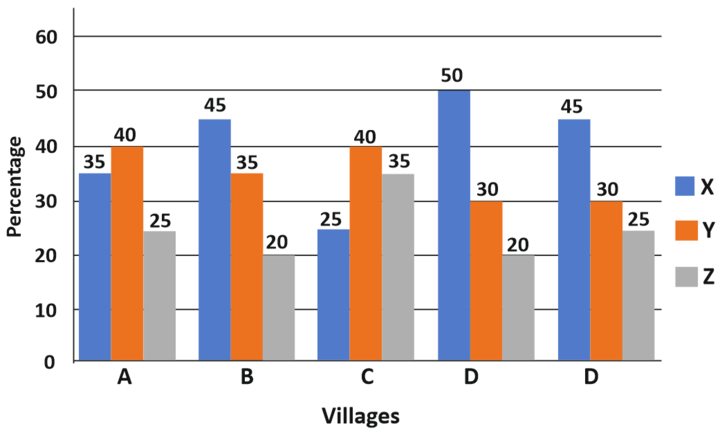
Question 6
The given Bar Graph presents the percentages of population in the age groups, X(above 50 years), Y(20 to 50 years), Z(below 20 years) in five different villages, A, B, C, D and E with total population of 5000, 6000, 8000, 4500 and 6000 respectively.
The number of persons having ages below 20 years in villages, B and C taken together is what percentage of the total population of the said villages?
Question 7
Direction: Study the following table carefully and answer the question given below. Marks (out of 50) obtained by three students A, B and C in five subjects in two periodical examination of each subject.
Which of the student had highest average marks in Geography in all periodicals?
Question 8
The given Bar Graph presents the percentages of population in the age groups. X(above 50 years). Y(20 to 50 years), Z(below 20 years) in five different villages, A. B. C. D and E with total population of 5000, 6000, 8000, 4500 and 6000 respectively.
What is the total number of persons in the age group of 20 to 50 years in the villages A and B, taken together?
Question 9
Direction: Study the following table carefully and answer the question given below. Marks (out of 50) obtained by three students A, B and C in five subjects in two periodical examination of each subject.
What was the average marks of the five subjects of student A in the 1st periodical?
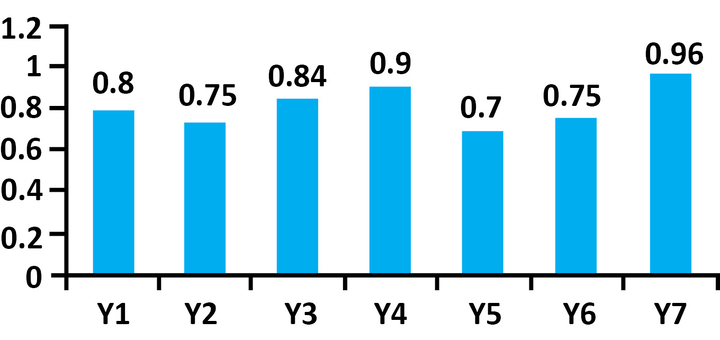
Question 10
The bar chart given below shows the ratio of expenditure to revenue for seven consecutive years Y1, Y2, Y3, Y4, Y5, Y6, and Y7.