Directions:Study the following table carefully and answer the question given below:
If the same percentage increase in the sales of Type I vehicles in 2004 over 2003 is expected in 2005. Approximately how many Type I vehicles will be sold in 2005?
Question 2
Directions:Study the following table carefully and answer the question given below:
The number of Type I vehicles sold in 2003 was approximately what percentage of the total number of vehicles sold in 2002?
Question 3
Directions:Study the following table carefully and answer the question given below:
In which of the following years was the Sales of Type–II vehicles maximum?
Question 4
Directions:Study the following table carefully and answer the question given below:
The percentage increase in sales in 2003 over the previous year was maximum for which Type of vehicles.
Question 5
The Table presents the amount of milk (in litres) sold by two milkmen in eight days.
What is the difference between the average milk sold per day by Milkman-1 and the average milk sold by Milkman - per day?
Question 6
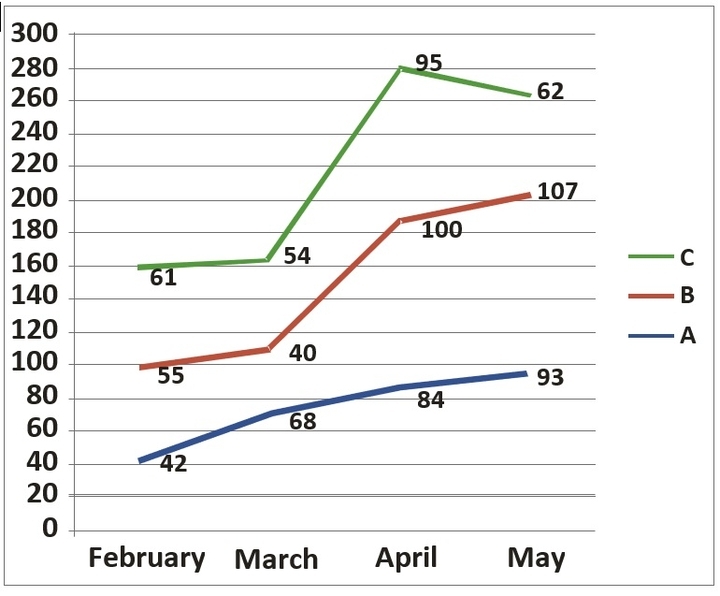
The line graph shows electricity consumption (in units) for three households A, B and C for months February to May.
In the given line graph, the percentage increase in electricity consumption of ‘B’ between March and May is:
Question 7
Refer to the below data table and answer the following Question.
What is the ratio of the total number of boys to girls?
Question 8
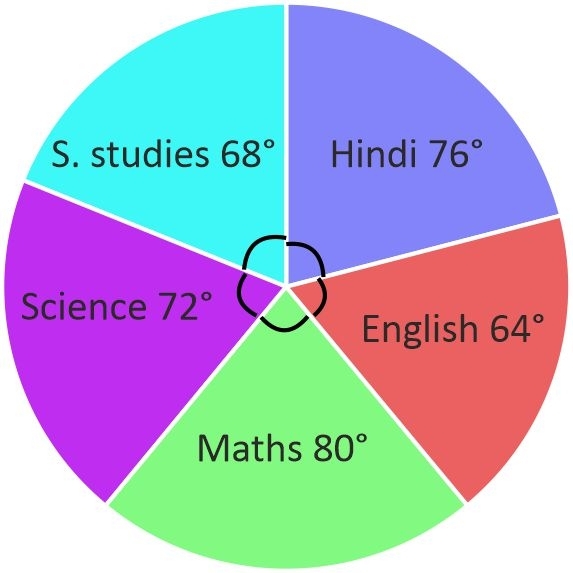
The given Pie Chart (angles are not as per any chosen scale) presents the marks scored by Amit in five subjects Maximum marks in each subject = 100. The total score of Amit = 450.
In how many subjects, did Amit score more than his average score?
Question 9
The following table shows the annual profit of a company (in Rs. lakh).
The period which has the maximum percentage increase in profit over the previous year is:
Question 10
The bar chart shows the annual food grain production (in million tonnes) for years 2012-2017. For how many years is the production less than the average production during the given period?