Time Left - 08:00 mins
Attempt now to get your rank among 1056 students!
Question 1
Direction:- Study the Bar diagram carefully and answer the questions. The Bar diagram shows the trends of foreign direct investment (FDI) into India from all over the World (in Rs. crores).
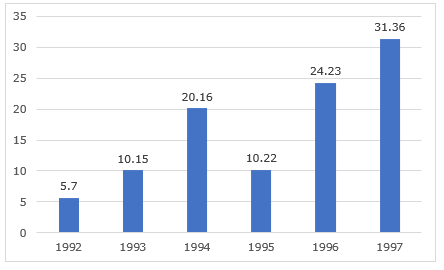
The year which exhibited the 2nd highest growth percentage in FDI in India over the period shown is
Question 2
The given pie chart shows the distribution (in degrees) of cars sold of different models by a company in 2015 – 16.

If number of cars sold of model C are 22000, then what will be the difference in the number of cars sold of model A and B?
Question 3
The given pie chart shows the distribution (in degrees) of cars sold of different models by a company in 2015 – 16.
If the number of cars sold of model D is 72900, then what is the total number of cars sold of all the models together by the company?
Question 4
The given pie chart shows the distribution (in degrees) of cars sold of different models by a company in 2015 – 16.
If 5% of the total number of cars sold of model E is 750, then what is the average number of cars sold of all the models?
Question 5
The following line graph shows the temperature of four Sundays of three cities.

In the line graph, what was the maximum recorded temperature of Chennai?
Question 6
The line graph shows the production (in tonnes) and the sales {in tonnes) of a company.

What is the percentage of maximum increase or reduction in the production of the company in comparison to the previous year?
Question 7
Direction:- Study the Bar diagram carefully and answer the questions. The Bar diagram shows the trends of foreign direct investment (FDI) into India from all over the World (in Rs. crores).
The sum of FDI of 1992 and 1993 is
Question 8
In the line graph, the temperature of four Sundays of three cities is shown.
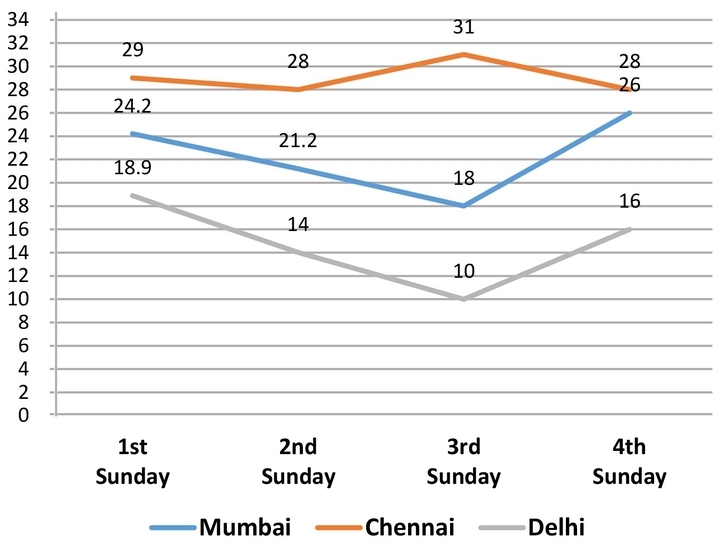
In the given line-graph, what was the average temperature in three cities on third Sunday? (Calculate up to first decimal place)
Question 9
The table given below shows the production of maize by 5 different states as a percentage of total production. Each state produces only maize and rice. There are three types of rice – R1, R2 and R3. The table also shows the R1 type of rice produced as a percentage of total rice production and the ratio of R2 and R3 type of rice. Total production by each state is 625000.

What is the sum of the total production of maize by state X and T and total production of R2 type of Rice by state S and R?
What is the sum of the total production of maize by state X and T and total production of R2 type of Rice by state S and R?
Question 10
Refer the below data table and answer the following Question.

How many cars were manufactured in the months of April and May?
How many cars were manufactured in the months of April and May?
- 1056 attempts
- 3 upvotes
- 4 comments
Aug 15SSC & Railway

