Attempt now to get your rank among 955 students!
Question 1
The given bar-graph shows the exports and imports (in crores of rupees) of five companies in a particular financial year.

Based on the given information, the ratio of exports to imports is highest in company_____.
Question 2

As per data available in the table above, what was the approximate percentage increase the percentage of the population affected by cold in 2020 when compared to the percentage of the population affected by cold in 1990?
Question 3
The following table gives the month-wise number of different types of scooters produced by a company during the first six months of 1992.

In which two of the six months was the total number of scooters produced by the company, of all types taken together equal?
Question 4

Which college had the maximum aggregate number of participants in all the five different subject Olympiads taken during that year?
Question 5

In which year was the difference in nominal profits earned by Company A and Company B the maximum?
Question 6
The table shows quantity of various food items used by a restaurant during for months of a year (in kg).

The quantity of wheat used in the month of July is what percentage of the total quantity of food items used in June?
Question 7


Difference between the number of males in B and C is 600 and difference between the number of females in D and E is 900. What is the sum of number of females in A, B, F and number of males in D, E, A?
Question 8

Which hill is the third highest?
Question 9
Production of food grains by a state over the years (1000 tonnes)
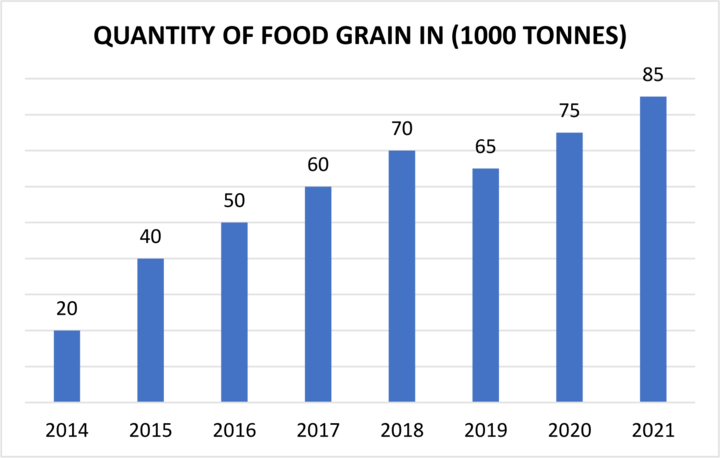
What was the percentage drop in the production of food grains from 2018 to 2019 (consider up to two decimals)?
Question 10

How many students scored at least 30 marks but less than 40 marks in the test?
- 955 attempts
- 2 upvotes
- 1 comment

