Time Left - 08:00 mins
Attempt now to get your rank among 936 students!
Question 1
Direction: The Bar graph given below shows the various expenditures of some different persons. Study the given data carefully and the related questions.

(Percentage of Expenditure)
(Percentage of Expenditure)
If B saves 20% of his salary and E saves 25% of his salary then what is respective ratio of their food expenditure where respective ratio of salaries of B and E is 8 : 7?
Question 2
Direction: The Bar graph given below shows the various expenditures of some different persons. Study the given data carefully and the related questions.
(Percentage of Expenditure)
(Percentage of Expenditure)
If salaries of A and D are 25000 and 30000 respectively and they saves 20% and 30% of their salaries then other expenditure of A is what percent of that of D?
Question 3
Direction: The following bar graph shows the sales (in thousands) of motor bikes by the factories, F1, F2, F3 and F4 in 2017, 2018 and 2019
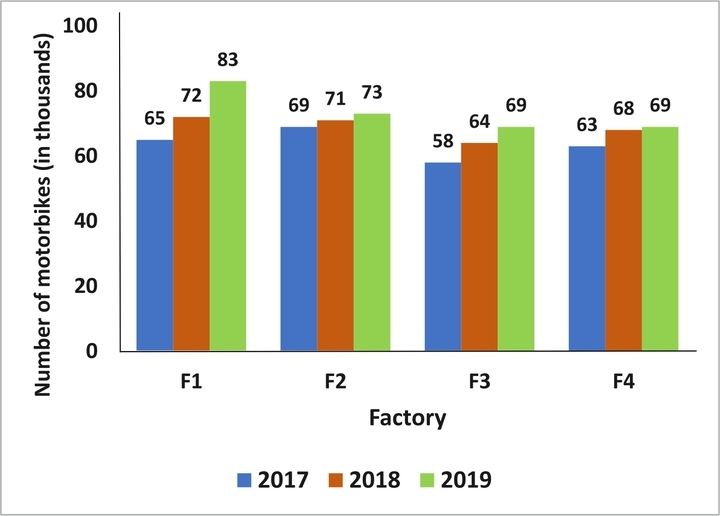
Which of the factories witnessed the highest increase in the percentage of sales from 2018 to 2019?
Question 4
Direction: Various expenditures incurred by a publishing company for publishing a book in 2011 are given below. Study the chart and answer the questions.

Price of a book is 20% above cost price. If the market price is ₹ 180, then the cost of paper for a single copy (in ₹) is
Question 5
Direction: The Bar graph given below shows the various expenditures of some different persons. Study the given data carefully and the related questions.
(Percentage of Expenditure)
(Percentage of Expenditure)
If respective ratio of salaries of B and C is 9 : 10 and they saves 20% and 25% then what is difference between rent expenditure of B and C?
Question 6
Direction: The Bar graph given below shows the various expenditures of some different persons. Study the given data carefully and the related questions.
(Percentage of Expenditure)
(Percentage of Expenditure)
If C spends 5000 on transport and saves 20 of his salary then what is the salary of C?
Question 7
Direction: The following graph shows the number of boys and girls in Class V, Class VI, Class VII and Class VIII. Study the graph and answer the question.
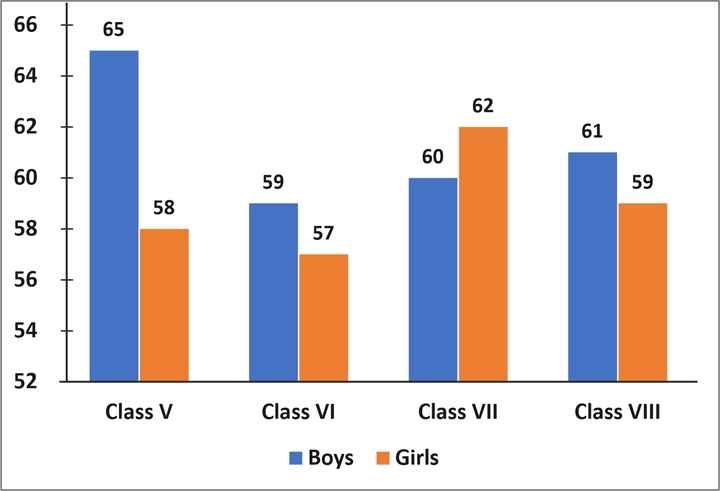
Which class has the maximum number of students?
Question 8
Direction: In the below questions the given pie chart shows the number of students admitted in different faculties of an engineering college. Study the chart and answer the questions.

If 625 students are in Civil branch then find the ratio of students in Law and computer science branch?
Question 9
Direction: The following graph represents the salary, expenditure, tax and savings (in rupees) per month of the persons A, B, C and D per month.
Study the graph and answer the question.
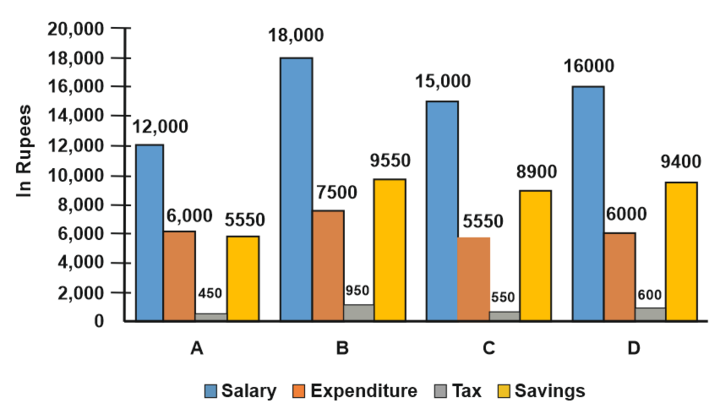
The tax as a percentage of salary is highest in case of:
Question 10
The Bar graph given below presents the maximum temperature (in oC) of a city for 10 different days spread over several months.
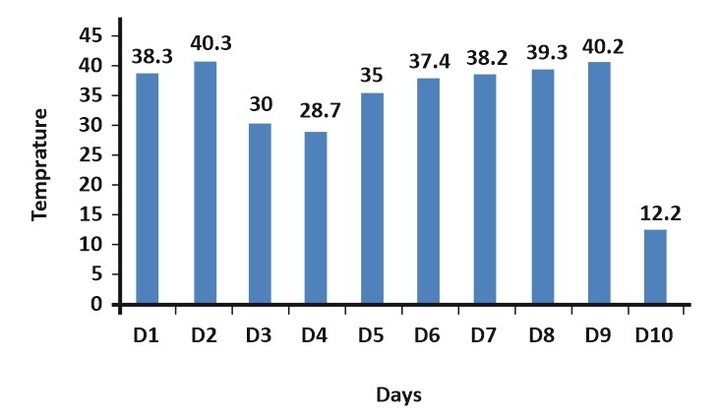
The temperature on D5 is how much percentage more than the temperature on D3?
- 936 attempts
- 2 upvotes
- 2 comments
Jun 30SSC & Railway

