Time Left - 10:00 mins
Attempt now to get your rank among 2487 students!
Question 1
Study the given graph and answer the question that follows.
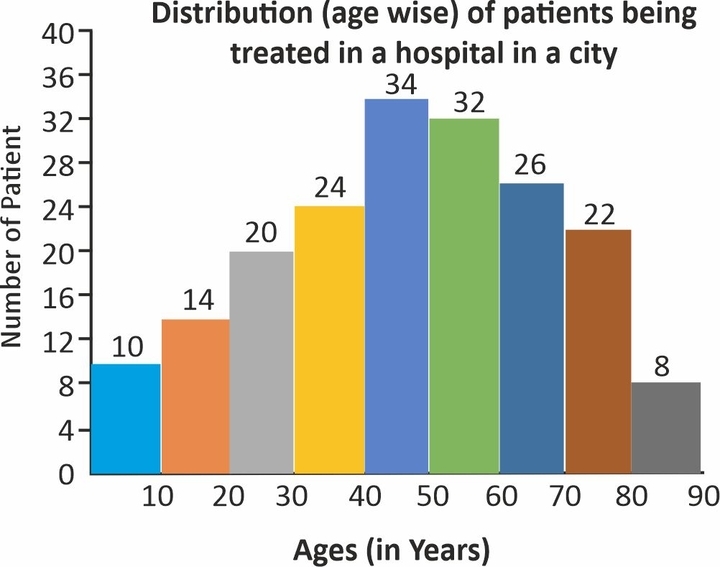
The number of patients aged 10 or more years but below 40 years is what per cent less than the number of patients aged 50 or more years but below 80 years?
Question 2
The Bar graph given below presents the maximum temperature (in C) of a city for 10 different days spread over several months.
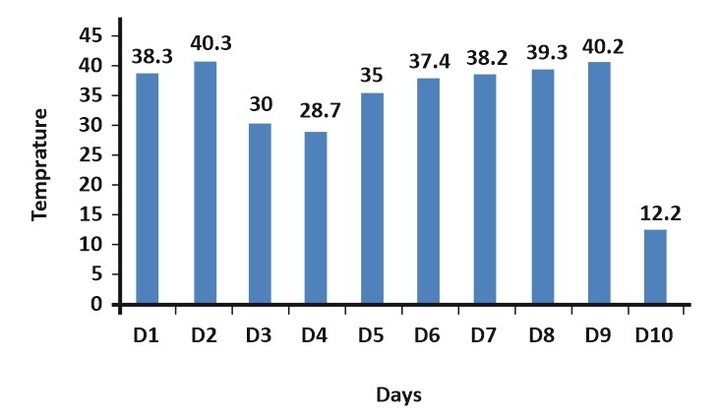
What is the average maximum temperature of the city per day for the given ten days?
Question 3
Direction: The following table represents the number of items sold by four divisions of a consumer goods dealer during 2010 to 2013

The combined sales figures in 2011 and 2013 of which division was the lowest?
Question 4
Direction: The following graph shows the number of boys and girls in Class V, Class VI, Class VII and Class VIII. Study the graph and answer the question.
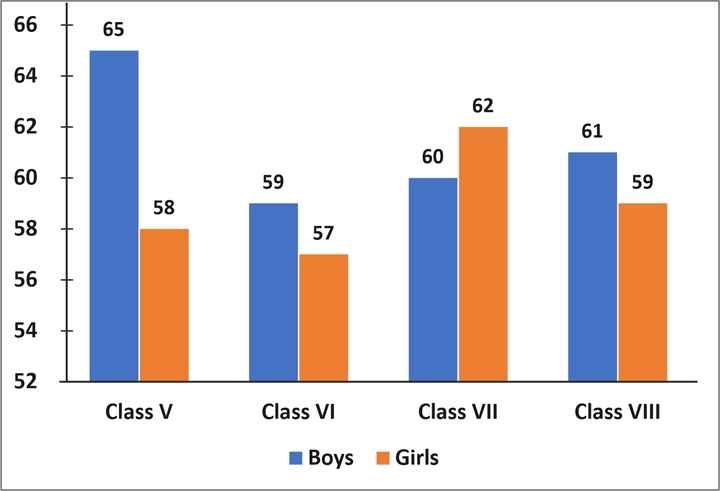
What is the average number of girls in all the classes?
Question 5
The Bar graph shown below presents the number of employees in an office during eight consecutive years.
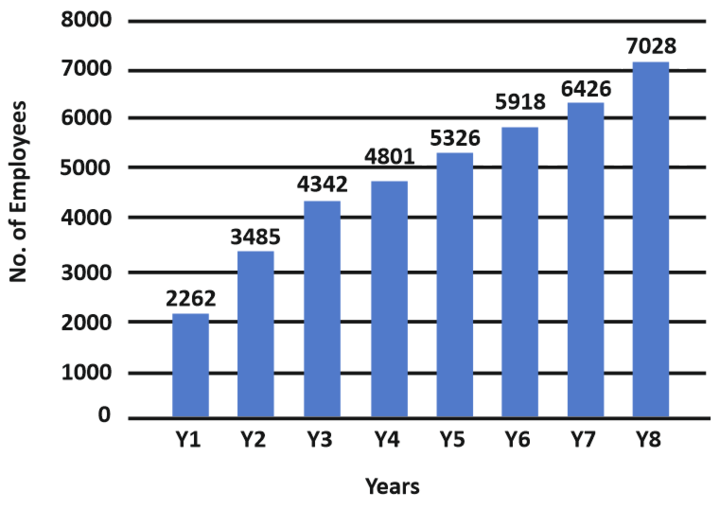
What is the growth percentage in the number of employees from Y5 to Y6?
Question 6
Direction: The following table represents the number of items sold by four divisions of a consumer goods dealer during 2010 to 2013
What is the ratio of total number of items sold by Y in 2012 and 2013 to that of Z in the same period?
Question 7
Direction: The following graph shows the number of boys and girls in Class V, Class VI, Class VII and Class VIII. Study the graph and answer the question.
In which class, the percentage increase in the number of boys as compared to its previous class is least?
Question 8
The following table shows the production of fertilizers (in lakh tonne) by six companies for 5 months (January to May).

There a continuous decrease in production over the months in:
Question 9
Direction: The following graph shows the number of boys and girls in Class V, Class VI, Class VII and Class VIII. Study the graph and answer the question.
Which class has the maximum number of students?
Question 10
The Bar graph given below presents the maximum temperature (in oC) of a city for 10 different days spread over several months.
The temperature on D5 is how much percentage more than the temperature on D3?
- 2487 attempts
- 1 upvote
- 13 comments
Jun 7SSC & Railway

