Time Left - 40:00 mins
Data Interpretation-1
Attempt now to get your rank among 54 students!
Question 1
Directions: Study the following pie- chart carefully and answer the questions given below :
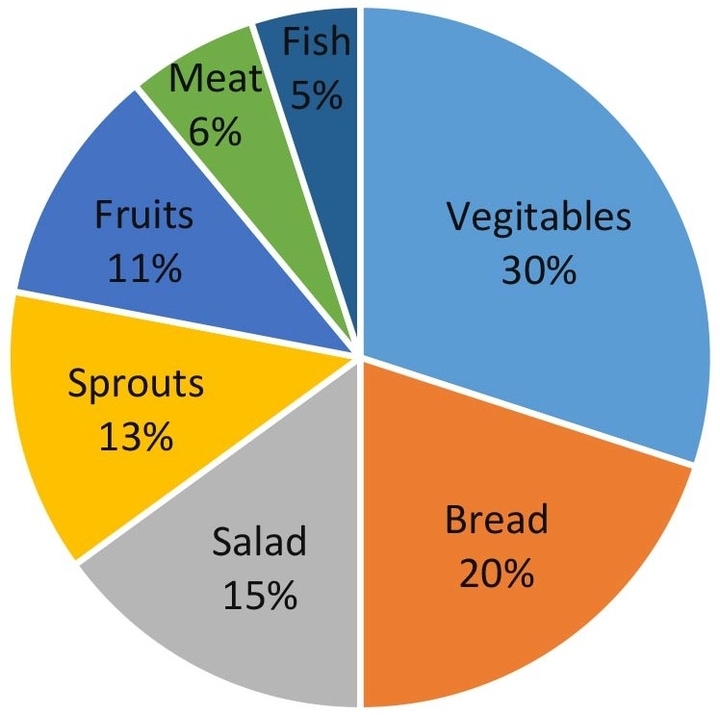
What is the total number of people preferring vegetables and those preferring sprouts?
Question 2
Directions: Study the following pie- chart carefully and answer the questions given below :
What is the difference between the total number of people preferring meat to the total number of people preferring fish?
Question 3
Directions: Study the following pie- chart carefully and answer the questions given below :
People preferring fruits are approximately what percent of the preferring vegetables?
Question 4
Directions: Study the following pie- chart carefully and answer the questions given below :
Out of the total sample population, how many people have given preference for fish?
Question 5
Directions: Study the following pie- chart carefully and answer the questions given below :
What is the ratio of the number of people preferring meat to the number of people preferring salad?
Question 6
Direction: The following pie-chart shows the preference of musical instruments of 60,000 people surveyed over whole India. Examine the chart and answer the questions:

Out of the total number of people who like flute, if 2100 people opt for some other instrument, then what will be the new percentage of people who like flute?
Question 7
Direction: The following pie-chart shows the preference of musical instruments of 60,000 people surveyed over whole India. Examine the chart and answer the questions:
The total number of people who prefer either Sarod or Guitar, is greater than the total number of people who prefer either Violin or Sitar by :
Question 8
Direction: The following pie-chart shows the preference of musical instruments of 60,000 people surveyed over whole India. Examine the chart and answer the questions:
The number of people who prefer the musical instrument Sarod is :
Question 9
Direction: The following pie-chart shows the preference of musical instruments of 60,000 people surveyed over whole India. Examine the chart and answer the questions:
If  of the people who prefer piano join the people who prefer flute, then what will be the new percentage of people who prefer flute?
Question 10
Direction: The following pie-chart shows the preference of musical instruments of 60,000 people surveyed over whole India. Examine the chart and answer the questions:
The number of people who prefer Guitar is greater than the total number of people who prefer either Flute or Piano by:
- 54 attempts
- 1 upvote
- 1 comment
Sep 15MPPSC

