Time Left - 08:00 mins
Attempt now to get your rank among 869 students!
Question 1
Direction: A survey of film watching habits of people living in five cities A, B, C, D and E is summarised below in a table. The column-I in the table gives the percentage of film-watchers in each city who watch only one film a week. The column-II gives the total number of film-watchers who watch two or more film a week.
Read the table and answer the following questions.

Read the table and answer the following questions.
Which city has highest number of film watchers?
Question 2
Direction: Study the following information carefully and answer the question given below:
Subscription to different Schemes of Mutual Fund Company over the months in year 2008-2009. (Rupees in Crore)

In which of the following months, the total subscription to the Schemes B and C was equal to the subscription to Scheme B in February 2009?
Question 3
Direction: A survey of film watching habits of people living in five cities A, B, C, D and E is summarised below in a table. The column-I in the table gives the percentage of film-watchers in each city who watch only one film a week. The column-II gives the total number of film-watchers who watch two or more film a week.
Read the table and answer the following questions.
Read the table and answer the following questions.
The total number of film watcher in the five city who watch only one film in a week is?
Question 4
The given Bar Graph presents the data of annual income (A) and annual expenditure (B) of an IT official in a multi-national company during the years 2012 to 2016.
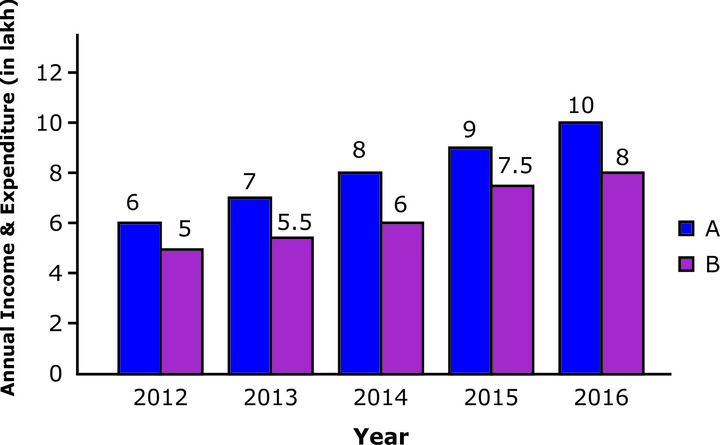
What was his average monthly savings in 2015 and 2016, taken together (correct to two decimal places)?
Question 5
Direction: Study the following line graph which gives the number of students who joined and left the school in the beginning of year for six years, from 1996 to 2001.

The number of students studying in the school during 1999 was?
Question 6
Refer the below data table and answer the following Question.
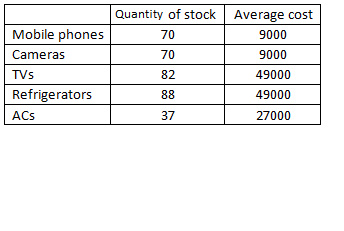
What is the value of the total stock (in lakh rupees)?
What is the value of the total stock (in lakh rupees)?
Question 7
The Bar graph given below presents the amount (volume in litres) of water in ten different mixtures.
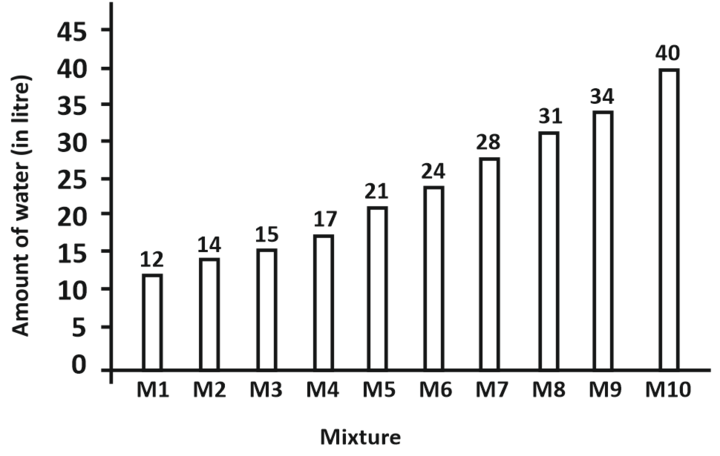
The amount of water in mixture M3 is what percent of amount of water in mixture M6?
Question 8
The given Bar Graph presents the percentages of population in the age groups, X(above 50 years), Y(20 to 50 years), Z(below 20 years) in five different villages, A, B, C, D and E with total population of 5000, 6000, 8000, 4500 and 6000 respectively.
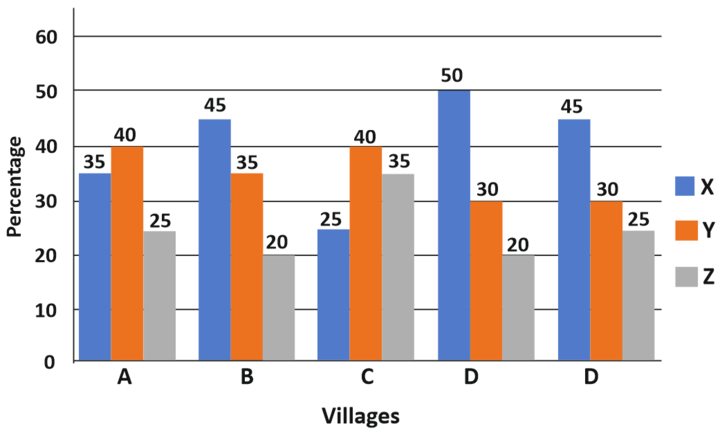
The number of persons having ages below 20 years in villages, B and C taken together is what percentage of the total population of the said villages?
Question 9
Refer the below table and answer the following Question.
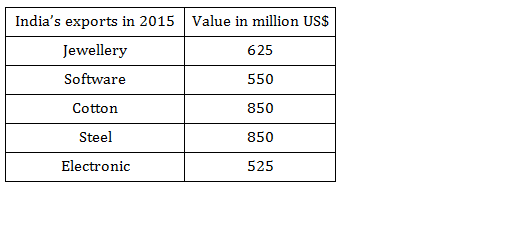
Jewellery was what percent of total exports?
Jewellery was what percent of total exports?
Question 10
Direction: Study the following pie chart and table to answer the questions. Total number of students admitted in a university in various fields = 5000
Distribution of the number of students into various fields:
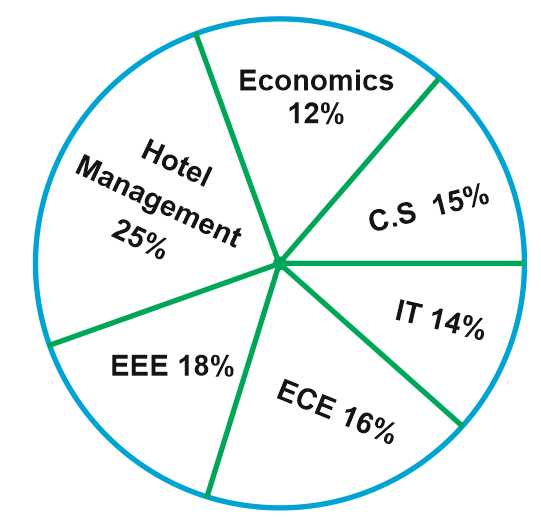
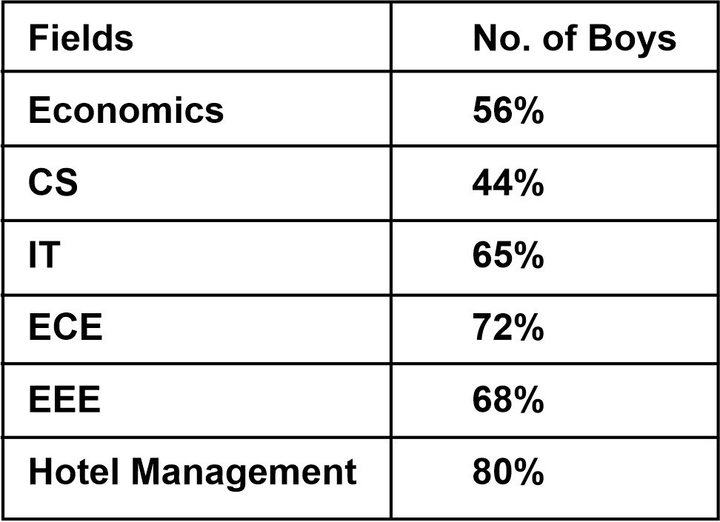
What is the average number of boys in CS, ECE and EEE fields?
- 869 attempts
- 0 upvotes
- 1 comment
Apr 5SSC & Railway

