COMBO CHART || DATA INTERPRETATION || CAT 2021 || 8 October
Attempt now to get your rank among 257 students!
Question 1
The analyst at a retail giant has modelled the consumer spending and consumer sentiment to prepare a strategy on product offers in the upcoming festive season. The data given in the figure are from last 10 years on 3 parameters namely, food spending (Food_Spend), style spending (Style_Spend), and sentiment index (Sentiment_Index). Study the figure below and Answer the following questions :
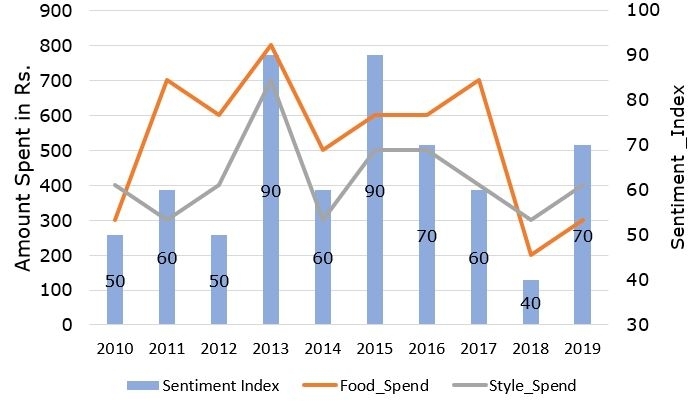
From the years mentioned below, in which year total of Food_Spend and StyleSpend as a proportion of Sentiment_Index is lowest ?
Question 2
The analyst at a retail giant has modelled the consumer spending and consumer sentiment to prepare a strategy on product offers in the upcoming festive season. The data given in the figure are from last 10 years on 3 parameters namely, food spending (Food_Spend), style spending (Style_Spend), and sentiment index (Sentiment_Index). Study the figure below and Answer the following questions :
Question 3
The analyst at a retail giant has modelled the consumer spending and consumer sentiment to prepare a strategy on product offers in the upcoming festive season. The data given in the figure are from last 10 years on 3 parameters namely, food spending (Food_Spend), style spending (Style_Spend), and sentiment index (Sentiment_Index). Study the figure below and Answer the following questions :
Question 4
The analyst at a retail giant has modelled the consumer spending and consumer sentiment to prepare a strategy on product offers in the upcoming festive season. The data given in the figure are from last 10 years on 3 parameters namely, food spending (Food_Spend), style spending (Style_Spend), and sentiment index (Sentiment_Index). Study the figure below and Answer the following questions :
Question 5
The line graph below shows the different principal amounts (in thousands) invested by Vishal on five different schemes (A, B, C, D and E) on compound interest. It also shows the rate of interest at which the principal amount is invested in different schemes and the time for the investment on different schemes.
(% rate of interest is an integer to nearest value )
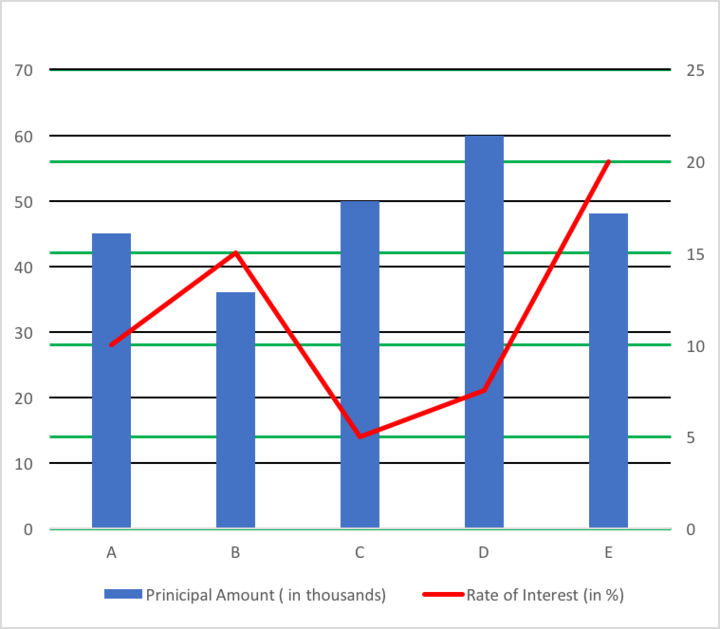
Note : *Secondary Axis represents rate of interest
*Primary Axis represents Principal Amount

Question 6
The line graph below shows the different principal amounts (in thousands) invested by Vishal on five different schemes (A, B, C, D and E) on compound interest. It also shows the rate of interest at which the principal amount is invested in different schemes and the time for the investment on different schemes.
(% rate of interest is an integer to nearest value )
Note : *Secondary Axis represents rate of interest
*Primary Axis represents Principal Amount
Question 7
The line graph below shows the different principal amounts (in thousands) invested by Vishal on five different schemes (A, B, C, D and E) on compound interest. It also shows the rate of interest at which the principal amount is invested in different schemes and the time for the investment on different schemes.
(% rate of interest is an integer to nearest value )
Note : *Secondary Axis represents rate of interest
*Primary Axis represents Principal Amount
Question 8
The following cascade bar shows five different mixtures of different types of Spirit (Spirit – 1, Spirit – 2 and so on) and Water. Every spirit is a mixture of Alcohol and Ether. The water content in the mixture has been represented by a line diagram.
(E.g. Mixture – 1 contains 45% water and 55% Spirit – 1. Spirit – 1 contains 50% Alcohol and 50% ether.)

Question 9
The following cascade bar shows five different mixtures of different types of Spirit (Spirit – 1, Spirit – 2 and so on) and Water. Every spirit is a mixture of Alcohol and Ether. The water content in the mixture has been represented by a line diagram.
(E.g. Mixture – 1 contains 45% water and 55% Spirit – 1. Spirit – 1 contains 50% Alcohol and 50% ether.)
Question 10
The following cascade bar shows five different mixtures of different types of Spirit (Spirit – 1, Spirit – 2 and so on) and Water. Every spirit is a mixture of Alcohol and Ether. The water content in the mixture has been represented by a line diagram.
(E.g. Mixture – 1 contains 45% water and 55% Spirit – 1. Spirit – 1 contains 50% Alcohol and 50% ether.)

- 257 attempts
- 1 upvote
- 2 comments

