- Home/
- GATE ELECTRONICS/
- GATE EC/
- Article
The pole zero plot given below corresponds to
By BYJU'S Exam Prep
Updated on: September 25th, 2023
The pole-zero plot given below corresponds to-
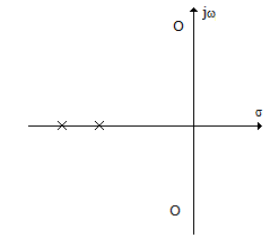
- Low pass filter
- High pass filter
- Bandpass filter
- Notch filter
Table of content
Answer – B. High pass filter
The pole-zero plot given below corresponds to a high pass filter.
Solution
The detailed solution to the question the pole-zero plot below corresponds to is provided here. We can plot an approximate bode plot for the given pole-zero diagram, with no poles or zeros at origin; hence at the start of the bode plot, the magnitude will be 0; first, two zeros are added so will add a slope of +40dB/Decade, later a pole is added which will contribute a -20dB/Decade slope, at last, another pole is added contributing -20dB/Decade making the magnitude response constant.
The magnitude for high frequencies is high, and for the low frequencies, it is low; hence we can call it a High pass filter. Therefore, the answer to the question the pole-zero plot given below corresponds to is a high pass filter.
Hence, Option (B) is correct.