Time Left - 10:00 mins
Attempt now to get your rank among 2693 students!
Question 1
Rosy aged 21 years married to Ramesh aged 26 years. After 3 years of their marriage, they are blessed with a baby girl. Find the sum of their ages after the birth of their child.
Question 2
There are three pipes A, B and C which can fill a water tank in 4 hours, 8 hours and 12 hours respectively. Arun starts recording the time of filling the water tank. At start pipe B and C were run together for 24 minutes and for filling the rest of the tank the three pipes were turned on together. What is the time recorded in the timer?
Question 3
There are two equal samples of milk. The first sample contains 25% milk and rest water and the second sample contains 65% milk and rest water. A mixture is created with 75% of the mixture being the first milk sample and rest being the second milk sample. What is the percentage of milk present in the mixture?
Question 4
In an election between two candidates, one got 65% of the total valid votes, 20% of the votes were invalid. If the total number of votes was 7500, the number of valid votes that the other candidate got, was:
Question 5
A money lender lends Rs. 400 for 3 years to a person and lends Rs. 500 for 4 years to the other person at the same rate of simple interest. If altogether he receives Rs. 160 as interest, what is the rate of interest per annum?
Question 6
Direction: Study the following Graph carefully and answer the question given below.
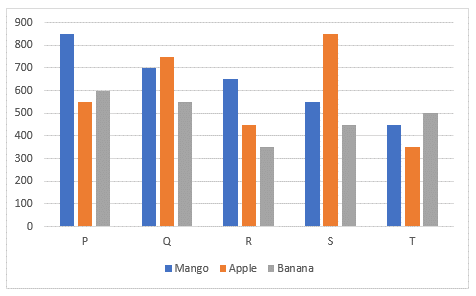
The given below bar graph shows quantity (in kg) of Mango, Apple & Banana consumed by various fruit corners P, Q, R, S and T over a week.
The given below bar graph shows quantity (in kg) of Mango, Apple & Banana consumed by various fruit corners P, Q, R, S and T over a week.
What is the ratio of the total quantity (in kg) of mangoes, apples and bananas consumed by Fruit corner Q to the total quantity (in kg) of mangoes, apples and bananas consumed by Fruit corner T?
Question 7
Direction: Study the following Graph carefully and answer the question given below.
The given below bar graph shows quantity (in kg) of Mango, Apple & Banana consumed by various fruit corners P, Q, R, S and T over a week.
The given below bar graph shows quantity (in kg) of Mango, Apple & Banana consumed by various fruit corners P, Q, R, S and T over a week.
What is the average quantity of the fruits consumed by each fruit corner?
Question 8
Direction: Study the following Graph carefully and answer the question given below.
The given below bar graph shows quantity (in kg) of Mango, Apple & Banana consumed by various fruit corners P, Q, R, S and T over a week.
The given below bar graph shows quantity (in kg) of Mango, Apple & Banana consumed by various fruit corners P, Q, R, S and T over a week.
Apple consumed by Fruit corner S is what percentage of its total consumption of mango and banana?
Question 9
Direction: Study the following Graph carefully and answer the question given below.
The given below bar graph shows quantity (in kg) of Mango, Apple & Banana consumed by various fruit corners P, Q, R, S and T over a week.
The given below bar graph shows quantity (in kg) of Mango, Apple & Banana consumed by various fruit corners P, Q, R, S and T over a week.
Mango consumed by Fruit corner R is approximately what percent of the Mango consumed by all the Fruits corners together?
Question 10
Direction: Study the following Graph carefully and answer the question given below.
The given below bar graph shows quantity (in kg) of Mango, Apple & Banana consumed by various fruit corners P, Q, R, S and T over a week.
The given below bar graph shows quantity (in kg) of Mango, Apple & Banana consumed by various fruit corners P, Q, R, S and T over a week.
What is the difference between the average quantity of apple consumed by all fruit corner and the average quantity of banana consumed by all fruit corner?
- 2693 attempts
- 4 upvotes
- 30 comments
Apr 22PO, Clerk, SO, Insurance

