Time Left - 07:00 mins
Attempt now to get your rank among 941 students!
Question 1
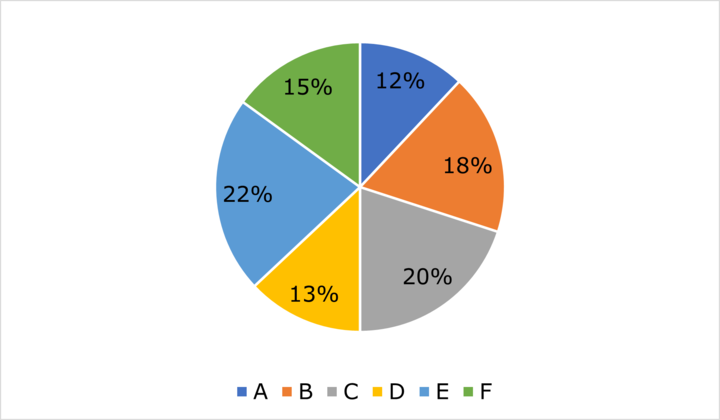
Directions: Study the following pie chart carefully and answer the questions that follow.
Pie chart given below gives information about percentage distribution of items in six different cities out of total items.
Total number of items in six cities = 25000
Pie chart given below gives information about percentage distribution of items in six different cities out of total items.
Total number of items in six cities = 25000

Average no. of items in city B and E are equal to total no. of items of which city?
Question 2
Directions: Study the following pie chart carefully and answer the questions that follow.
Pie chart given below gives information about percentage distribution of items in six different cities out of total items.
Total number of items in six cities = 25000
Pie chart given below gives information about percentage distribution of items in six different cities out of total items.
Total number of items in six cities = 25000

If in city C and E, 90% and 85% of total items are sold respectively, then find the number of items which are left unsold in these two cities?
Question 3
Directions: Study the following pie chart carefully and answer the questions that follow.
Pie chart given below gives information about percentage distribution of items in six different cities out of total items.
Total number of items in six cities = 25000
Pie chart given below gives information about percentage distribution of items in six different cities out of total items.
Total number of items in six cities = 25000

What is the difference between total items of city A and E together to total items of city B and D together?
Question 4
Directions: Study the following pie chart carefully and answer the questions that follow.
Pie chart given below gives information about percentage distribution of items in six different cities out of total items.
Total number of items in six cities = 25000
Pie chart given below gives information about percentage distribution of items in six different cities out of total items.
Total number of items in six cities = 25000

If ratio of defective items to non-defective items in city F and city D is 3 : 2 and 2 : 3 respectively, then find difference between no. of defective items in these cities?
Question 5
Directions: Study the following pie chart carefully and answer the questions that follow.
Pie chart given below gives information about percentage distribution of items in six different cities out of total items.
Total number of items in six cities = 25000
Pie chart given below gives information about percentage distribution of items in six different cities out of total items.
Total number of items in six cities = 25000

If in city E all the items are sold and then 20% of them are returned back as they are found defective, then find the difference between no. of items which are returned back in city E and total no. of items in city D?
- 941 attempts
- 0 upvotes
- 17 comments
Feb 4PO, Clerk, SO, Insurance

