Time Left - 05:00 mins
Attempt now to get your rank among 2606 students!
Question 1
Direction: Study the following pie-chart carefully and answer the questions that follow.
The pie-chart given below shows the percentage-distribution of the number of people of various professions.
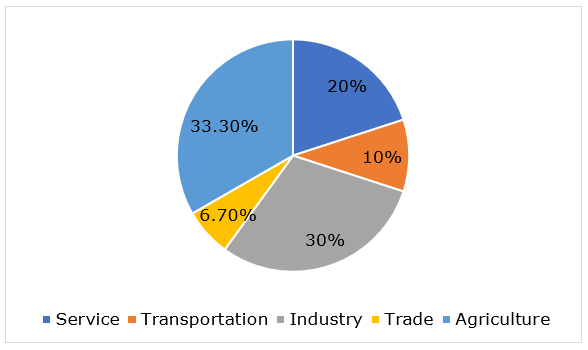
Population of the town = 40000
The pie-chart given below shows the percentage-distribution of the number of people of various professions.
Population of the town = 40000
How many more people are involved in service than in trade?
Question 2
Direction: Study the following pie-chart carefully and answer the questions that follow.
The pie-chart given below shows the percentage-distribution of the number of people of various professions.
Population of the town = 40000
The pie-chart given below shows the percentage-distribution of the number of people of various professions.
Population of the town = 40000
The total number of people involved in agriculture and trade is equal to which of the following?
Question 3
Direction: Study the following pie-chart carefully and answer the questions that follow.
The pie-chart given below shows the percentage-distribution of the number of people of various professions.
Population of the town = 40000
The pie-chart given below shows the percentage-distribution of the number of people of various professions.
Population of the town = 40000
What is the difference between the maximum number of people involved and minimum number of people involved in various professions?
Question 4
Direction: Study the following pie-chart carefully and answer the questions that follow.
The pie-chart given below shows the percentage-distribution of the number of people of various professions.
Population of the town = 40000
The pie-chart given below shows the percentage-distribution of the number of people of various professions.
Population of the town = 40000
What is the sectorial angle made by the people involved in Service in the given pie-chart?
Question 5
Direction: Study the following pie-chart carefully and answer the questions that follow.
The pie-chart given below shows the percentage-distribution of the number of people of various professions.
Population of the town = 40000
The pie-chart given below shows the percentage-distribution of the number of people of various professions.
Population of the town = 40000
What is the ratio of the people involved in service to that of industry?
- 2606 attempts
- 4 upvotes
- 77 comments
Jun 15PO, Clerk, SO, Insurance

