Time Left - 07:00 mins
Attempt now to get your rank among 2426 students!
Question 1
Direction: The graph given below shows the campus enrollment in 6 departments in a university established in the year 2015. The enrollment in subsequent years are shown below that:
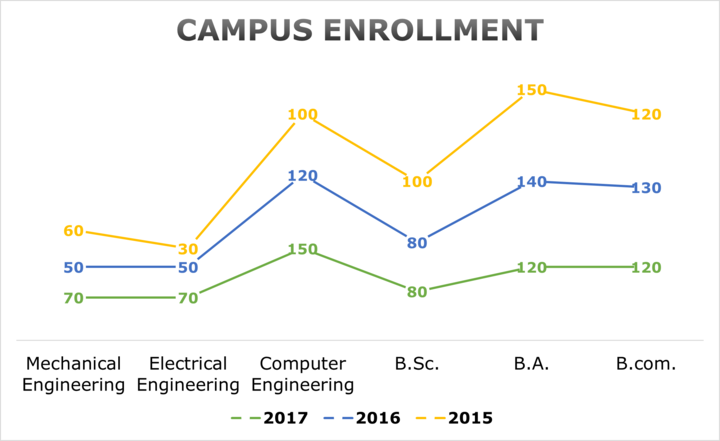
Enrollment in Mechanical engineering in the year 2017 is what percentage of the total enrollment in all branches in the year 2017?
Question 2
Direction: The graph given below shows the campus enrollment in 6 departments in a university established in the year 2015. The enrollment in subsequent years are shown below that:
In which year, the share of Computer Science engineering is maximum in engineering Sector?
Question 3
Direction: The graph given below shows the campus enrollment in 6 departments in a university established in the year 2015. The enrollment in subsequent years are shown below that:
Assuming the expenses to be the same in all three years, what is the approximate percentage increase in the profit from 2015 to 2017, if the fee structure is increased by 15% from 2015 to 2017?
Question 4
Direction: The graph given below shows the campus enrollment in 6 departments in a university established in the year 2015. The enrollment in subsequent years are shown below that:
If x is the change in percent of students enrolled in B.com from 2015 to 2016 and y is the change in percent of students enrolled in B.com from 2016 to 2017, then
Question 5
Direction: The graph given below shows the campus enrollment in 6 departments in a university established in the year 2015. The enrollment in subsequent years are shown below that:
What is the average increase per department in enrollment from year 2016 to 2017?
- 2426 attempts
- 2 upvotes
- 7 comments
Jun 29PO, Clerk, SO, Insurance

