- Home/
- CDS & Defence/
- Article
Draw the graphs of the equations x – y + 1 = 0 and 3x + 2y – 12 = 0. Determine the coordinates of the vertices of the triangle formed by these lines and the x-axis and shade the triangular region.
By BYJU'S Exam Prep
Updated on: September 25th, 2023
The coordinates of the vertices of the triangle formed by these lines and the x-axis and shade of the triangular region are (2, 3), (-1, 0), and (4, 0).
Given that, the equations for graphs are x – y + 1 = 0 and 3x + 2y – 12 = 0
Step 1: Now we have to find the table from the first equation that is x – y + 1 = 0
For, x – y + 1 = 0
On rearranging we get y = x + 1
|
x |
0 |
1 |
2 |
|
y |
1 |
2 |
3 |
Step 2: Now we have to find the table from the second equation that is 3x + 2y – 12 = 0
For, 3x + 2y – 12 = 0
On rearranging we get y = ½ (12 – 3x)
|
x |
4 |
2 |
0 |
|
y |
0 |
3 |
6 |
Step 3: Drawing the equations’ graph by using the values from the corresponding table
The equations’ graphical depiction is:
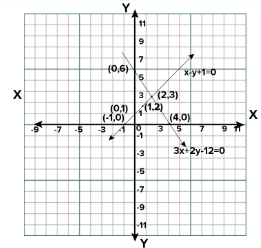
We can see in the graphic that these lines cross each other at point
(2, 3) and x-axis at (-1, 0) and (4, 0)
therefore, the vertices of the triangle are (2, 3), (-1, 0), and (4, 0).
Summary:
Draw the graphs of the equations x – y + 1 = 0 and 3x + 2y – 12 = 0. Determine the coordinates of the vertices of the triangle formed by these lines and the x-axis and shade the triangular region.
The graphs of the equations x – y + 1 = 0 and 3x + 2y – 12 = 0 are mentioned above. The coordinates of the vertices of the triangle formed by these lines and the x-axis and shade of the triangular region are (2, 3), (-1, 0), and (4, 0)