DOUBLE LINE CHART || Data Interpretation || CAT 2021 || 13 September
Attempt now to get your rank among 470 students!
Question 1
Direction: Study the following line graphs carefully to answer the given questions.
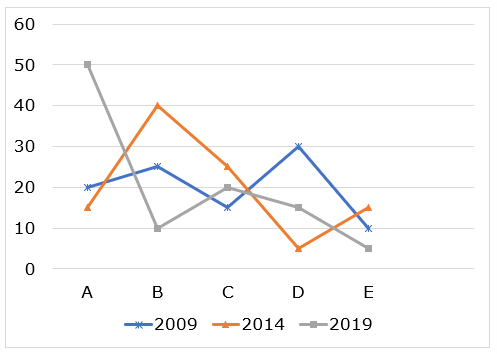
The first line graph represents the total number of voters who cast their votes in three different elections i.e., in year 2009, 2014 and 2019. The second line graph represents the percentage of the number of votes received by five candidates A, B, C, D and E in the given elections.
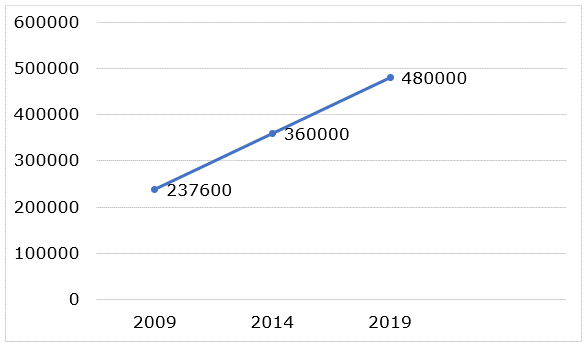
What was the difference between the number of votes received by the winning candidate in the elections of year 2009 and that by the winning candidate in the elections of year 2019?
Question 2
Direction: Study the following line graphs carefully to answer the given questions.
The first line graph represents the total number of voters who cast their votes in three different elections i.e., in year 2009, 2014 and 2019. The second line graph represents the percentage of the number of votes received by five candidates A, B, C, D and E in the given elections.
Question 3
Direction: Study the following line graphs carefully to answer the given questions.
The first line graph represents the total number of voters who cast their votes in three different elections i.e., in year 2009, 2014 and 2019. The second line graph represents the percentage of the number of votes received by five candidates A, B, C, D and E in the given elections.
Question 4
Direction: Study the following line graphs carefully to answer the given questions.
The first line graph represents the total number of voters who cast their votes in three different elections i.e., in year 2009, 2014 and 2019. The second line graph represents the percentage of the number of votes received by five candidates A, B, C, D and E in the given elections.
Question 5
Direction: Study the following line graphs carefully to answer the given questions.
The first line graph represents the total number of voters who cast their votes in three different elections i.e., in year 2009, 2014 and 2019. The second line graph represents the percentage of the number of votes received by five candidates A, B, C, D and E in the given elections.
Question 6
Direction: Study the following line graphs carefully to answer the given questions.
The first line graph represents the total number of voters who cast their votes in three different elections i.e., in year 2009, 2014 and 2019. The second line graph represents the percentage of the number of votes received by five candidates A, B, C, D and E in the given elections.
Question 7


Average number of students passed in exam1 from state UP, MP and Bihar is approximate what percent more/less than the average number of students passed in the same exam from UK and Punjab.
Question 8
Question 9
Question 10
- 470 attempts
- 2 upvotes
- 2 comments

