
Data Interpretation Pattern For Bank Exam 2023
By BYJU'S Exam Prep
Updated on: September 25th, 2023

Data Interpretation Pattern For Bank Exam 2023: The candidates who are appearing in the IBPS PO mains exam should know that Data Interpretation carries major weightage in the bank exams. So, make sure that you are practising rigorously by learning effective tips and tricks to solve the Data Interpretation questions.
In this article, we have shared the Data Interpretation Pattern of the SBI PO and IBPS PO Mains Exam. Data Analysis & Interpretation is one very important section in SBI PO and IBPS PO Main Exam. This section consists of a total of 35 questions and the total time duration for this section is 45 minutes. It is very important to understand the pattern of each section very well in which you are going to appear to score well.
Table of content
-
1.
Data Interpretation Pattern For Bank Exam 2023

-
2.
Data Interpretation Questions Asked in the IBPS PO Mains Exams
-
3.
Key Facts Related to Data Interpretation Questions
-
4.
Tabular Presentation
-
5.
Line Graph
-
6.
Bar Chart
-
7.
Pie Chart
-
8.
Mixed DI
-
9.
Paragraph / Caselet Data Interpretation Questions
-
10.
Probability
-
11.
Data Sufficiency
-
12.
-
13.
Smart Approach to Solve Data Interpretation Section
Data Interpretation Pattern For Bank Exam 2023
Data Analysis & Interpretation has always been the most difficult section in the SBI PO and IBPS PO Main Exam, and we can expect it to be the same this time too. This section is to test your calculation and analytical approach i.e. your ability to interpret data and information given in the form of representation like Pie charts, Bar graphs, Table charts, Line Graphs, etc.
Data Interpretation questions require basic knowledge of Percentage, Ratio, and Average chapters of quantitative aptitude. It is very important to be well familiar with the basic concepts of these chapters. The level of the questions in this section generally ranges from Moderate to Difficult. Before attempting the questions, one should look at the data or graph carefully, and understand the small specifications and the type of questions asked in the exam.
Data Interpretation Questions Asked in the IBPS PO Mains Exams
The following table shows the details of the Data Interpretation questions asked in the IBPS PO Mains Exam. Refer to the following table to have an idea about the level and topics of the DI Questions asked in the main exams.
| SBI PO Mains | IBPS PO Mains |
|
Caselete – 5 Questions Time & Work DI- 3 Questions Funnel Shape DI- 5 Questions- Data of loan was given Graph-based DI – 5 Questions Scattered graph – 3 Questions |
Caselete – 5 Questions – based on Population-based Double Bar Graph – 5 Questions Double Table (Missing) – 5 Questions Time and work-based cases based on X and Y values. Pie chart- Z1 Z2 Z3 Z4, 4 segments, 1st degree was given, and condition-based relations were given. Probability-based questions were asked- 3 question |
Key Facts Related to Data Interpretation Questions
Some of the facts related to Data Interpretation questions are given below.
- The questions consist of Percentage increase/decrease.
- The questions consist of finding the average/ratio.
- The questions consist of finding a total/difference.
So we can say that a set of data interpretation questions basically consists of normal questions using a huge amount of data. The various possible categories of data interpretation are as follows:
- Tabular Presentation
- Line Chart
- Bar Chart
- Pie Chart
- Mixed DI
- Paragraph/Caselet/ Language DI
- Probability
- Data Sufficiency
Now let us have in-depth knowledge of the description of the Questions asked in the Paper-
Tabular Presentation
The questions can be asked
Direction: Study the given table carefully and answer the following questions.
The table given below shows the total hats sold by sellers A and B in five days.
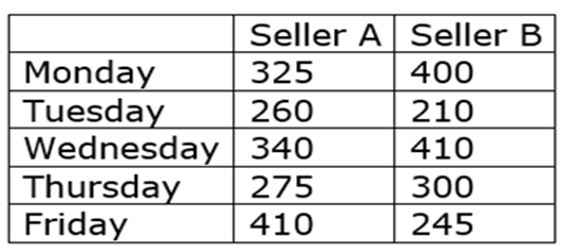
Question 1: What is the ratio of the number of hats sold by Seller A on Monday and Tuesday together to the number of hats sold by Seller B on Wednesday, Thursday, and Friday together?
- 107: 191
- 107: 181
- 127: 291
- 117: 191
- None of these
Solution: The answer is D.
The number of hats sold by Seller A on Monday and Tuesday together = 325 + 260 = 585
The number of hats sold by Seller B on Wednesday, Thursday, and Friday together = 410 + 300 + 245 = 955
Required ratio = 585 : 955 = 117 : 191
Line Graph
Direction: Study the following graph carefully and answer the questions that follow.
The following line graph gives the percentage of the number of candidates who qualified for an examination out of the total number of candidates who appeared for the examination over a period of seven years from 1994 to 2000.
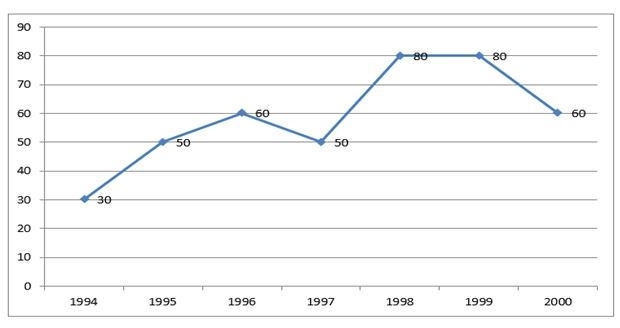
Question 2: If there was an increase in the qualifying percentage by 5 points in the year 1995, how many students would have qualified if there were 20000 students?
- 12000
- 11000
- 15000
- 18000
- 19000
Solution: The answer is B.
Required answer = (50 + 5)% × 20000 = 11000
Bar Chart
Direction: Study the following Bar graph carefully and answer the questions that follow.
In the following Bar graph, the expenditure (in billion dollars) of India and Pakistan on crude oil is given for the period 2001 to 2005.
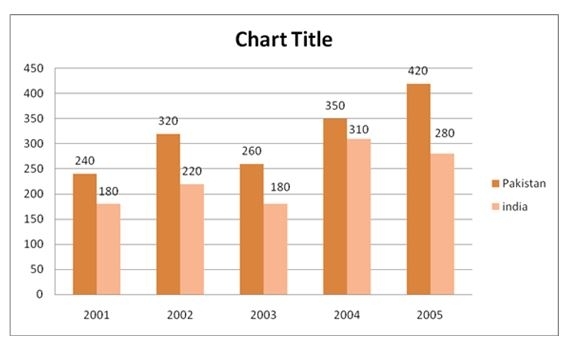
Question 3: What is the maximum percentage increase for Pakistan for any two consecutive years?
- 30.75%
- 32.60%
- 33.33%
- 34.61%
- 30%
Solution: The answer is D.
By observation, we can see that the maximum increase for Pakistan is from the year 2003 to 2004 which is, 350 – 260 = 90
Required, Percentage increase = 90/260*100 = 34.61%
You can attempt SBI PO main mock test with the SBI PO Test Series designed by the experts of BYJU’s Exam Prep.
Pie Chart
Direction: Read the information given below carefully and answer the questions that follow.
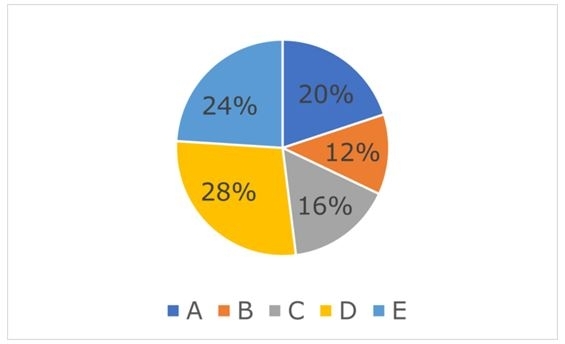
In an exam, Amit obtained a total of 550 marks. The percentage distribution of marks obtained by Amit in 5 subjects A, B, C, D, and E are given in the pie chart below.
Solution: The answer is D.
Marks scored by Amit in A and C together = 20% + 16% = 36%
Marks scored by Amit in B and D together = 12% + 28% = 40%
Required percentage = (40-36/40)X100 = 10%
Mixed DI
Direction: Study the Pie – chart carefully and answer the following questions.
The pie chart below shows the percentage of investment by Rahul in 5 different schemes – A, B, C, D, and E, while the table shows the annual rate of interest offered in the schemes and the total time of investment in years.
Total investment = Rs. 150000
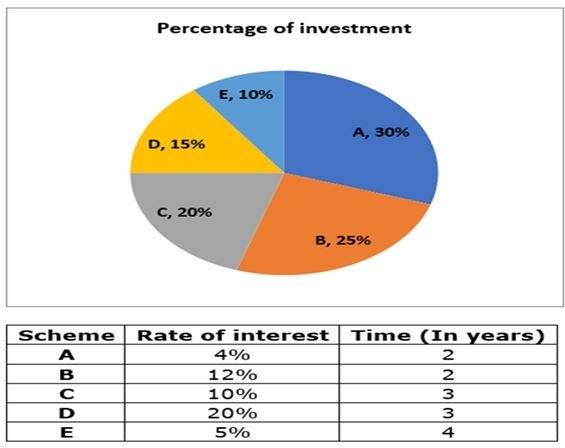
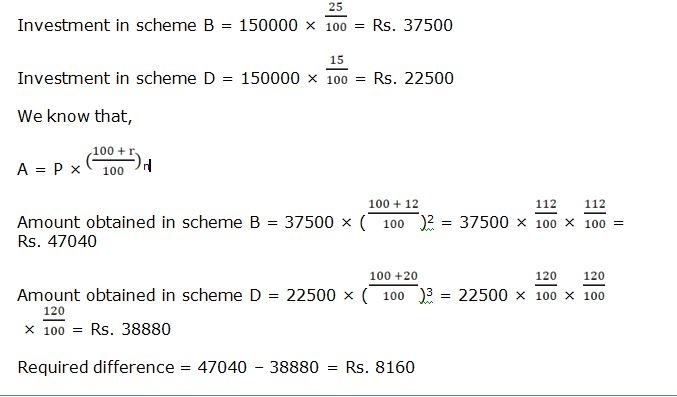
Question 5: If schemes B and D, offer compound interest, then find the difference of their amounts.
- Rs. 8360
- Rs. 7540
- Rs. 6500
- Rs. 8160
- None of these
Solution: The answer is D.
Paragraph / Caselet Data Interpretation Questions
The data in a caselet is presented in the form of a paragraph. The data is not accompanied by any charts or graphs. The length of caselets, as well as the quantity of information contained in each phrase and paragraph, varies greatly. When reading a caselet, it’s always a good idea to highlight key facts and figures and, if necessary, create your own table/chart/graphs to help you answer the questions. For instance –
Direction: Read the following information carefully & answer the questions that follow: A survey was done on some of the students of university P & Q. Total selected students were 750. The ratio of students selected from university P & Q is in the ratio 7:8. There is a total of 450 girls altogether. The ratio of girls & boys from university P is in the ratio of 3:2. 2/3 of the girls from university P play tennis. Total 200 girls play tennis. 3/5 of the boys from university P play volleyball. 1/3 of the girls from university Q play volleyball. Total 130 students from university P play volleyball. 1/4 of the boys of university P play tennis. Total 100 students from university Q play volleyball. 2/5 of the boys from university Q play tennis. The rest of the students play chess.
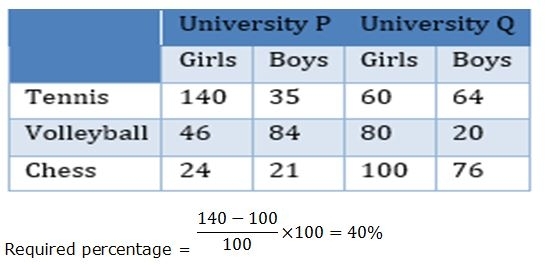
Question 6: Number of girls playing tennis from university P is how much percent more than the number of girls playing chess from university Q?
- 20%
- 30%
- 40%
- 50%
- 60%
Solution: The answer is C.
Number of students in university P = (7/15) × 750 = 350
Number of students in university Q = 750 − 350 = 400
Number of girls in university P = (3/5) × 350 = 210
Number of boys in university P = (2/5) × 350 = 140
Number of girls in university P who play Tennis = (2/3) × 210 = 140
Number of girls in university Q who play Tennis = 200 − 140 = 60
Number of boys in university P who play volleyball = (3/5) × 140 = 84
Number of girls in university Q = 450 − 210 = 240
Number of boys in university Q = 400 − 240 = 160
Number of girls in university Q who play volleyball = (1/3) × 240 = 80
Number of girls in university P who play volleyball = 130 − 84 = 46
Number of boys in university P who play Tennis = (1/4) × 140 = 35
Number of boys in university Q who play volleyball = 100 − 80 = 20
Number of boys in university Q who play Tennis = (2/5) × 160 = 64
Number of girls in university P who play Chess = 210 − (140 + 46) = 24
Number of boys in university P who play Chess =140 − (35 + 84) = 21
Number of girls in university Q who play Chess = 240 − (60 + 80) = 100
Number of boys in university Q who play Chess = 160 − (64 + 20) = 76
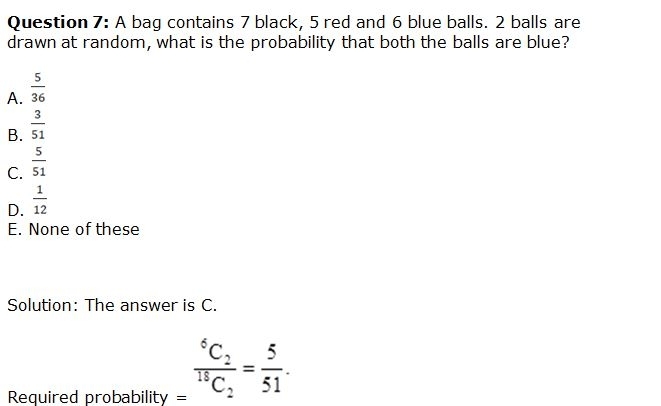
Probability
Data Sufficiency
The best thing about data sufficiency questions is that we don’t have to solve the given questions. We only need to find out which statements are required sufficient to solve the questions. So these questions are easy in comparison to other questions where we have to do the exact calculations.
Direction: Each question below is followed by two statements I and II. You have to determine whether the data given in the statement is sufficient for answering the question. You should use the data and your knowledge of Mathematics to choose the best possible answer.
Question 8: There are three pipes, A, B, and C where A and B are inlet pipes while C is the outlet pipes. Find the time taken to fill or empty the tank if A and C are opened.
Statement I: Pipes A and B together can fill the tank in 24 minutes while pipe C is 50% less efficient than pipe B.
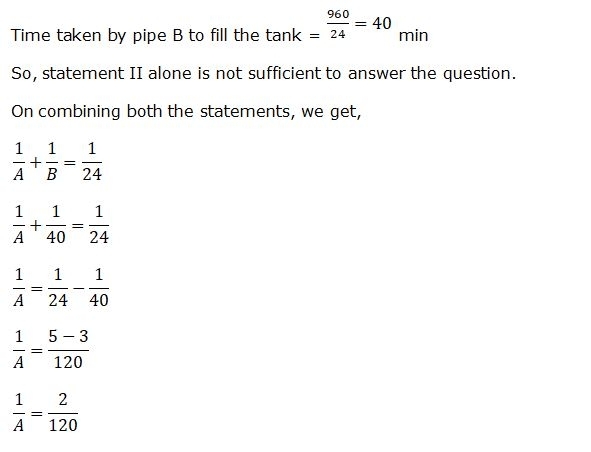
Statement II: The capacity of the tank is 960 liters, and the rate of flow of pipe B is 24 liters/min.
A. If the data in Statement I alone are sufficient to answer the question, while the data in Statement II alone are not sufficient to answer the question.
B. If the data in Statement II alone are sufficient to answer the question, while the data in Statement I alone are not sufficient to answer the question.
C. If the data either in Statement I or in Statement II alone are sufficient to answer the question.
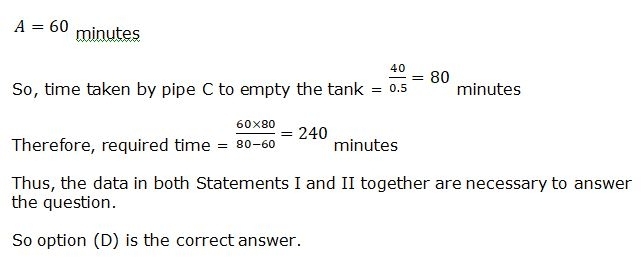
D. If the data in both Statements I and II together are necessary to answer the question.
E. If the data even in both Statements I and II together are not sufficient to answer the question.
Solution: The answer is D.
Statement I:
Time is taken by pipes A and B together to fill the tank = 24 minutes
So, the statement I alone is not sufficient to answer the question.
Statement II:
Smart Approach to Solve Data Interpretation Section
- Do not start solving any set immediately, first look at all DI. sets and then decide, which set has lesser variables in terms of conditions and time-consuming.
- Fix the time for each set and try to solve easier questions first.
- Pick 2 or 3 questions from each set that can be solved in lesser time, don’t try to solve all 5 questions of each set, if it finds difficult or lengthy in the calculation.
- For D.I. questions learn the structured approach and in order to answer the questions, it is important that you analyze the right data.
Hence you should make a sensible choice in picking up the right set and doing the right thing before investing any time in a particular set or just jumping from one set to another.
Feel free to connect with the counsellors to get your answers if you are stuck anywhere regarding the preparation for an exam. Just Dial the number and vanish your doubts.


