CSIR NET 2022 | General Aptitude | DI Special Quiz (10.02.2022)
Attempt now to get your rank among 50 students!
Question 1
The bar graph, given here, shows the number of tickets sold by 6 students A, B. C, D, E and F during a fair. Observe the graph arid answer question based on it.
Total number of tickets sold by A, B and C is
Question 2
Directions: Based on the given information answer the following questions:
This graph shows the number of students who apply for different IIM’s
Which IIM received the highest number of applications?
Question 3
The following pie chart shows the expenditure of a country on importing various products during a particular year.
Answer the given question based on the pie chart.
If the amount spent on importing only machines during the year was ₹ 8 crore, then what was the total amount (approximate) spent on importing all the various products in that year?
Question 4
Study the following graph which shows income and expenditure of a company over the years and answer the questions.
The difference in profit (in Rs. Crores) of the company during 2007 and 2008 is
Question 5
Study the following table carefully and answer the question that follows.
Expenditure or a company (in ₹ lakh) per year over the years
What is the ratio of the expenditure on transport in the year 2013 to the total expenditure on transport for all the years taken together?
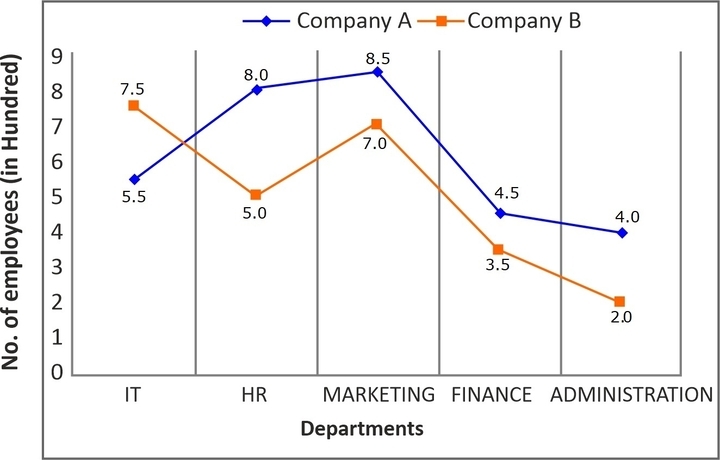
Question 6
Direction: Study the following graph carefully and answer the question given below. The number of employees (in hundred) working in various departments of two different companies.
The number of employees working in the Marketing department of company B is what per cent of the total number of employees working in that company?
Question 7
Direction: the following table represents the marks of four students in five subjects.
Consider the information and answer questions based on it.
Who has the highest average marks?
(A) Shyam (B) Sunil
(C) Jagdish (D) Rajesh
Question 8
The given bar graph shows the number of tourists to various states. Study the graph and answer the question that follows.
The number of tourists to which of the following states is less than 10% of the total number of tourists?
Question 9
Direction: The pie chart represents the likes of students of a class. Consider the pie chart and answer questions based on it.
If total number of students is 500, the ratio of students who like computer Science, Chemistry and Physics to that of the other remaining subjects is
(A) (B)
(C) (D)
Question 10
Direction: Read the following information carefully and answer the questions given below it: Raw Cotton Procurement prices of a Spinning Mill.
The absolute price increase of which two years is the same?