CSIR NET 2022 || General Aptitude || Data Interpretation Quiz (26.01.2022)
Attempt now to get your rank among 43 students!
Question 1
The production of different Vehicle in 2000 are given by the following Chart.
Which of the following statements is true?
Question 2
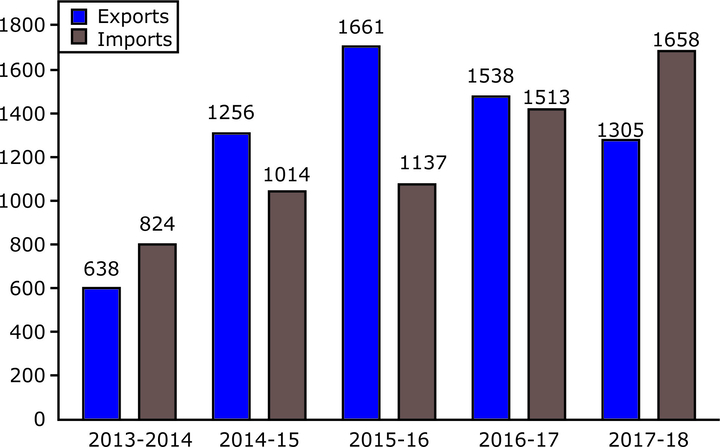
The given bar graph presents the Imports and Exports of an Item (in tonnes) manufactured by a company for the five financial years, 2013-2014 to 2017-2018 .
In which financial year the total of the Exports and Imports is the lowest?
Question 3
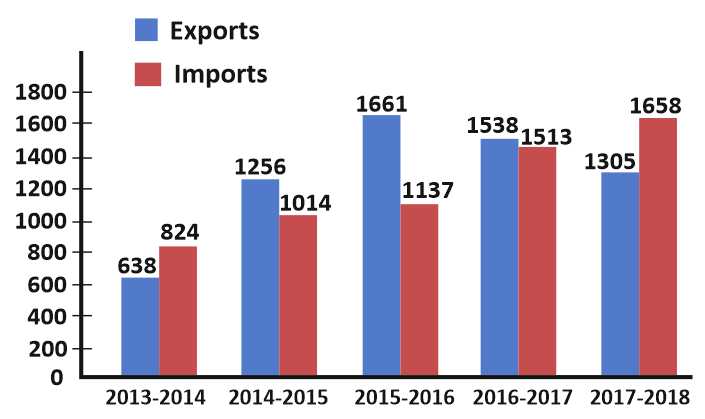
The given bar graph presents the Imports and Exports of an Item (in tonnes) manufactured by a company for the five financial years, 2013-2014 to 2017-2018 .
In which financial year the percentage increase in Imports and Exports taken together is the highest in comparison to its previous financial year?
Question 4
Directions: Read the following information carefully and answer the questions that follow: Out of the two bar graphs provided below, first one shows the amounts (in Lakh Rs.) invested by a sugar Company in purchasing raw materials over the years and the other shows the value (in Lakh Rs.) of finished Products sold by the Company over the years.
Amounts (in Lakh Rs.) invested by a sugar Company in purchasing raw materials
Value (in Lakh Rs.) of finished Products sold by the Company
The maximum difference between the amount invested by sugar company in Raw materials and value of sales of finished goods was during which year?
Question 5
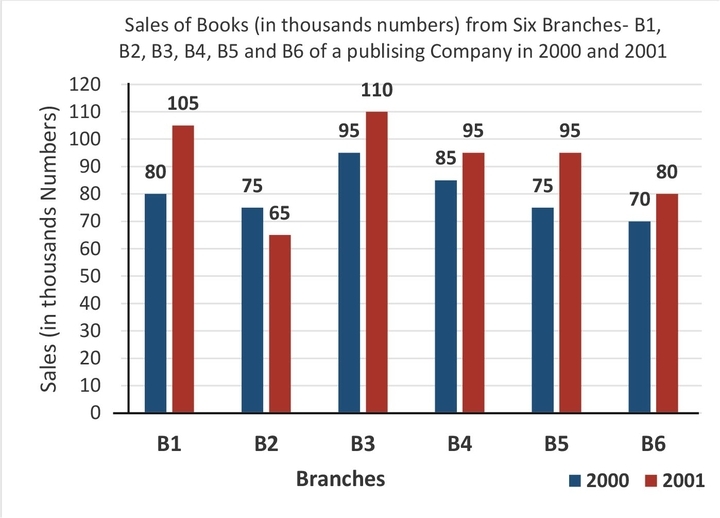
The given bar chart, shows the sales of books (in thousand number) from six branches of publishing company during two consecutive year 2000 and 2001.
In the given bar-chart, sales of branches B1, B3 and B5 taken together for both the years (in thousand numbers) is:
Question 6
A bar graph showing the heights of six mountain peaks. Study the bar graph and answer questions Which peak is the second highest?
Question 7
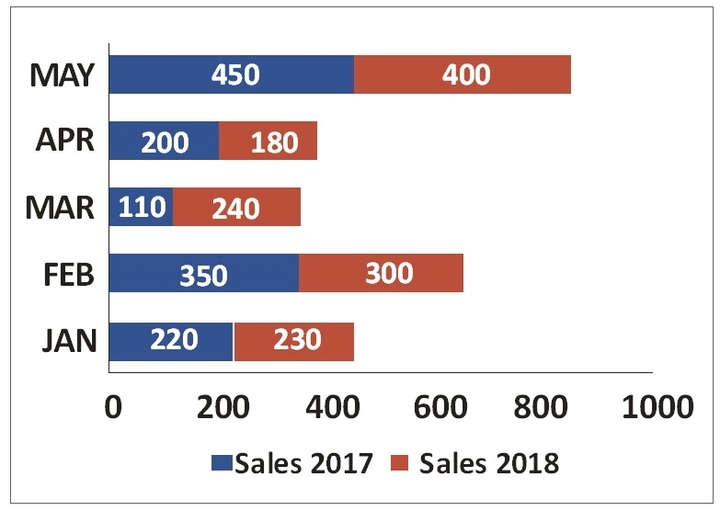
The given bar chart shows the details of cycle sales by a company between January and May for years 2017 and 2018 .
In the given bar-chart, which month sales show the maximum decrease in 2018 as compared to 2017?
Question 8
The given bar chart shows the details of cycle sales by a company between January and May for years 2017 and 2018
In the given bar-chart, which month sale shows the maximum increase in 2018 as against 2017?
Question 9
The bar graph given below represents the revenue of a firm for 8 years. All the revenue figures have been shown I terms of Rs. Crores. By what percentage has the revenue of the firm decreased in 2010 with respect to the last year?
Question 10
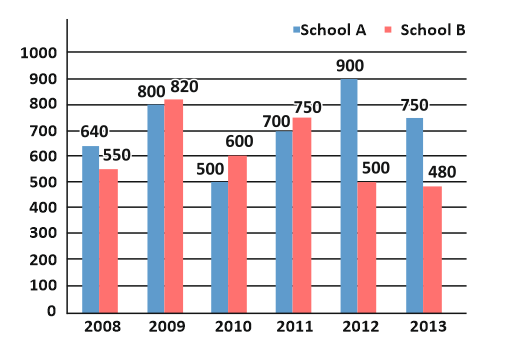
Direction: The given bar graph shows the number of students of two schools over a period of six years.
In the bar graph, in which year is the absolute difference of the students from schools A to B taken together, the maximum?