Time Left - 20:00 mins

CSIR NET 2022 || General Aptitude || Data Interpretation Quiz (23.02.2022)

Attempt now to get your rank among 84 students!

Question 1

The given bar graph shows the imports and exports (in ` crores) of steel by a country from 2013 to 2017.

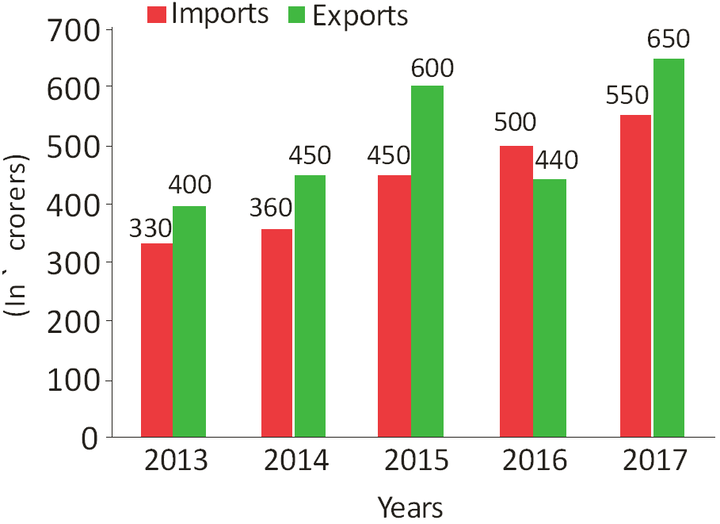
The total imports of steel in 2014, 2016 and 2017 Is what percent less than the total exports in 2013, 2015 and 2017 (correct to one decimal place)?

Question 2

The given bar graph shows the imports and exports (in crores) of steel by a country from 2013 to 2017.

What is the ratio of the total imports in 2015 and 2017 to the total exports in 2013 and 2016?

Question 3

Direction: Study the bar graph given below carefully and answer the following question based on it.
The birth rate of which country is 25% more than that of Germany?

Question 4

Answer the following questions based on given information

The above table shows the percentage of students of different classes indulged in different sports. All the classes have equal number of students.
What percent of total students play cricket?

Question 5

The given graph shows the marks obtained by students in an examination.

The number of students who obtained less than 300 marks is what percent more than the number of students who obtained 350 or more marks?
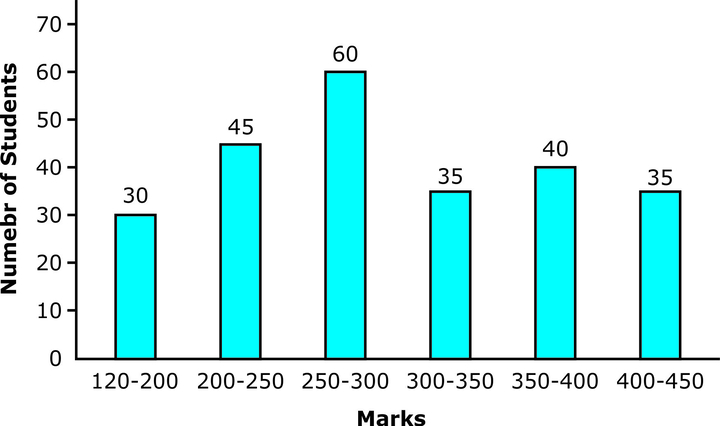
Question 6

The bar graph shows the exports of Cars of Type A and B (in Rs Million)

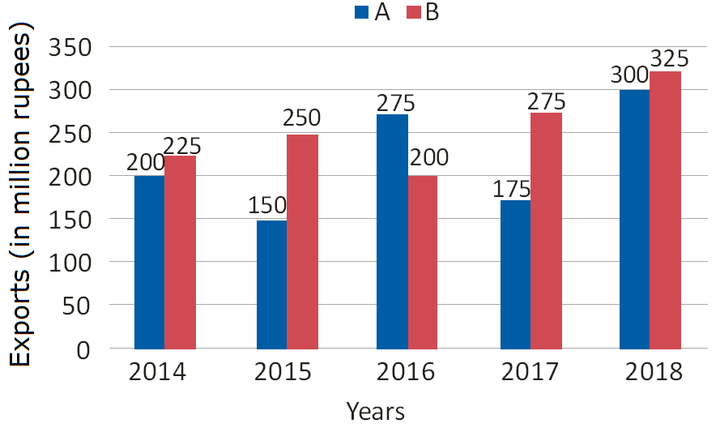
What is the ratio of the total exports of cars of type A in 2014 and 2018 to the total exports of cars of type B in 2015 and 2016?

Question 7

The bar graph shows the production of table fans in a factory during one week. Study the bar graph and answer the question.
The maximum production exceeds the minimum production by:

Question 8

Direction: Himalaya Drug Company provides five different products. The sales of these five products (in lakh number of packs) during 2016 & 2017 are shown in the following graph.

The sales of Lip-balm in 2017 was greater by what percent as compared to sales of Soap in 2017?

Question 9

Answer the question based on the line graph given below-

[Sale of oneplus & apple mobile in different years]

From year 2001-2003, how many years, the sale of oneplus mobile is higher than Apple?

Question 10

The line graph shows the number of vacancies for management trainees in a certain company. Study the diagram and then answer the following questions

The salary of a management trainee in the company is Rs 15,000, then what was the increase in the expense (in Rs lakhs) due to salaries that had to be paid when posts were filled for the vacancies in the year 2012?

  • 84 attempts
  • 1 upvote
  • 1 comment
Aug 23CSIR NET & SET