CSIR NET 2022 || General Aptitude || Data Interpretation Quiz (16.02.2022)
Attempt now to get your rank among 56 students!
Question 1
Study the given bar graph that shows the registration of cars and total vehicles for the first four months of the year 2015in Delhi and answer the question that follows.
How many more vehicles, other than cars, were registered in April 2015 compared to January 2015?
Question 2
The Pie chart show the angular representation of five different Employment sectors. The total number of employees in these five sectors is 7,20,000.
How much percent employees are in Service Sector?
Question 3
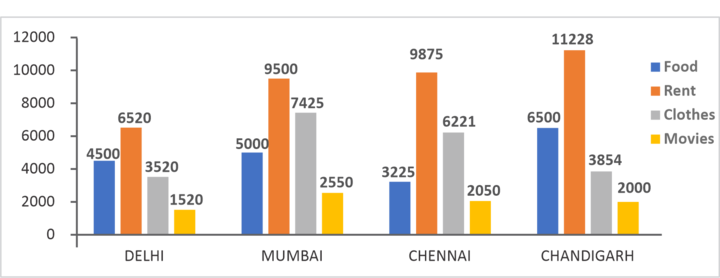
Direction:The given bar chart shows average
expenditure on food, rent, clothes and movies by individuals in a month in 4 different cities.
Which city has the maximum expenditure by an individual in a month?
Question 4
The Pie chart given below presents the distribution of costs of making a water bottle by a company. If the company earns 20% on cost per bottle and the cost of packaging one bottle is ₹0.50, then what is the selling price of one bottle?
Question 5
The following graph given shows the profit made by a cosmetic company (in ₹ thousand) over 5 years (from 2014 to 2018). Answer the given question based on the graph.
What is the ratio of the number of years in which the profits are below average to those in which the profits are above average?
Question 6
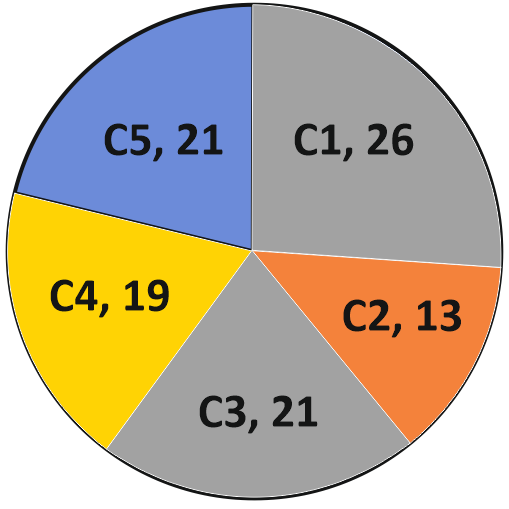
Direction: The given Pie Chart (central angles are not as per any chosen scale) presents the percentage of the number of refrigerators of five different companies (with reference to the total number of refrigerators) in a hotel. The total number of refrigerators = 3700.
What is the difference in number of refrigerators supplied to the hotel by companies C1 and C5?
Question 7
The following Bar Diagram depicts figures for some agricultural imports from January-May, 2008. Answer (as closely as possible) the questions using the date provided here Agricultural Imports - January to May
What in the average cost of potato import in February and March?
Question 8
The following bar graph shows the production of automobiles (in thousands) by three branches, A, B and C, of an automobile company over 5 years. Based on the graph answer the question given below.
What is the percentage increase in the production of automobiles by branch B from 2012 to 2015?
Question 9
The total population of a state having four districts is 6lakh. The percentage distribution of population among the states is given in the pie chart below. On the basis of data of pie chart and the table calculate the ratio of population of men in district A and district B?
Question 10
The Graph depicts the flight fare for the months of October, November, December (in Rupees)