Combo Chart || Data Interpretation || CAT 2021 || 29 July
Attempt now to get your rank among 171 students!
Question 1
6 students (Sebastian, Rick, Healy, Yoshi, Ilahat, Ursula) appeared in three examinations (i.e., Maths, Science and English).
The combo-chart given below shows the marks obtained by them in these three subjects.

Maximum marks in the given three subjects are 100, 150 and 200 in any order.
Marks-index of a student = ![]() × 100
× 100
Which of the following students had the second lowest overall percentage of marks?
Question 2
6 students (Sebastian, Rick, Healy, Yoshi, Ilahat, Ursula) appeared in three examinations (i.e., Maths, Science and English).
The combo-chart given below shows the marks obtained by them in these three subjects.
Maximum marks in the given three subjects are 100, 150 and 200 in any order.
Marks-index of a student = ![]() × 100
× 100
Question 3
6 students (Sebastian, Rick, Healy, Yoshi, Ilahat, Ursula) appeared in three examinations (i.e., Maths, Science and English).
The combo-chart given below shows the marks obtained by them in these three subjects.
Maximum marks in the given three subjects are 100, 150 and 200 in any order.
Marks-index of a student = ![]() × 100
× 100
Question 4
6 students (Sebastian, Rick, Healy, Yoshi, Ilahat, Ursula) appeared in three examinations (i.e., Maths, Science and English).
The combo-chart given below shows the marks obtained by them in these three subjects.
Maximum marks in the given three subjects are 100, 150 and 200 in any order.
Marks-index of a student = ![]() × 100
× 100
Question 5
The analyst at a retail giant has modelled the consumer spending and consumer sentiment to prepare a strategy on product offers in the upcoming festive season. The data given in the figure are from last 10 years on 3 parameters namely, food spending (Food_Spend), style spending (Style_Spend), and sentiment index (Sentiment_Index). Study the figure below and Answer the following questions :
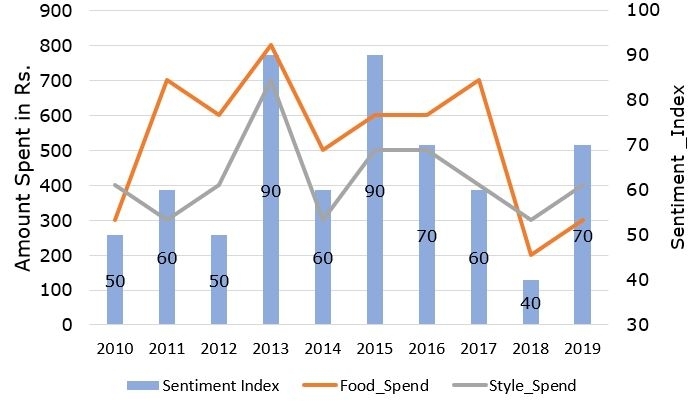
From the years mentioned below, in which year total of Food_Spend and StyleSpend as a proportion of Sentiment_Index is lowest ?
Question 6
The analyst at a retail giant has modelled the consumer spending and consumer sentiment to prepare a strategy on product offers in the upcoming festive season. The data given in the figure are from last 10 years on 3 parameters namely, food spending (Food_Spend), style spending (Style_Spend), and sentiment index (Sentiment_Index). Study the figure below and Answer the following questions :
Question 7
The analyst at a retail giant has modelled the consumer spending and consumer sentiment to prepare a strategy on product offers in the upcoming festive season. The data given in the figure are from last 10 years on 3 parameters namely, food spending (Food_Spend), style spending (Style_Spend), and sentiment index (Sentiment_Index). Study the figure below and Answer the following questions :
Question 8
In the following Bar graph shows the total population(in 1000) and Line graph shows the percentage. 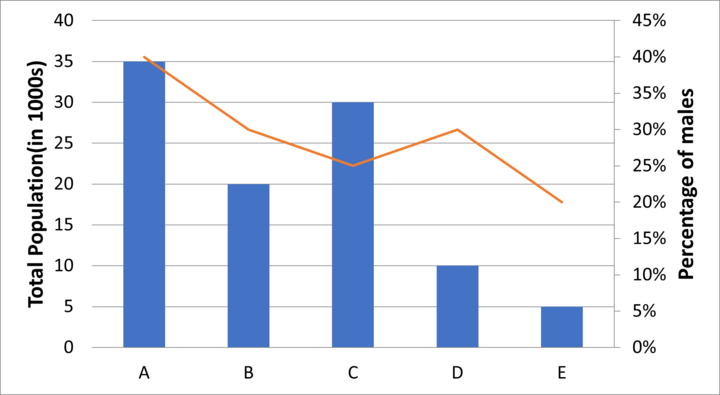
Note:
I. Percentage of male population = 1.5 × Percentage given in line graph
II. Male population = % of male population × Total population
III. Female population = Total population – Male population
The population of males in city B is what percent less than the population of females in city C?
Question 9
In the following Bar graph shows the total population(in 1000) and Line graph shows the percentage.
Note:
I. Percentage of male population = 1.5 × Percentage given in line graph
II. Male population = % of male population × Total population
III. Female population = Total population – Male population
Question 10
In the following Bar graph shows the total population(in 1000) and Line graph shows the percentage.
Note:
I. Percentage of male population = 1.5 × Percentage given in line graph
II. Male population = % of male population × Total population
III. Female population = Total population – Male population
- 171 attempts
- 0 upvotes
- 0 comments

